2014issue C1010-15
Constructing volume-scaled candlestick charts
A session's remaining technical record is five session fields: open, high, low, close, and volume. A hybrid mark keeps a volume-scaled box and paints the candle body inside it, so all five fields sit in one comparable entry in the price pane.
- After news and fundamentals are set aside, the technical record of a session is five session fields: open, high, low, close, and volume.
- A volume-scaled box sets height to the high-low range and width to that session's volume, so a heavier-volume period occupies more horizontal space than a lighter one.
- Merging candlesticks onto those boxes and then discarding the outline removes the volume-shape cue the construction is built to show.
- The hybrid mark keeps the box dimensions, paints the candle body inside, and lets easy movement, difficult movement, checkerboards, and breakout confirmation be read as one comparable entry.
Five session fields
After news and fundamentals are set aside, a session's technical record consists of five session fields: open, high, low, close, and volume. Those five values are what remain to be drawn.
A conventional bar mark makes the high-low spread and the open and close ticks easy to read. Volume plotted along the lower margin is hard to assign to a specific session.
Boeing daily close, April–July 2014
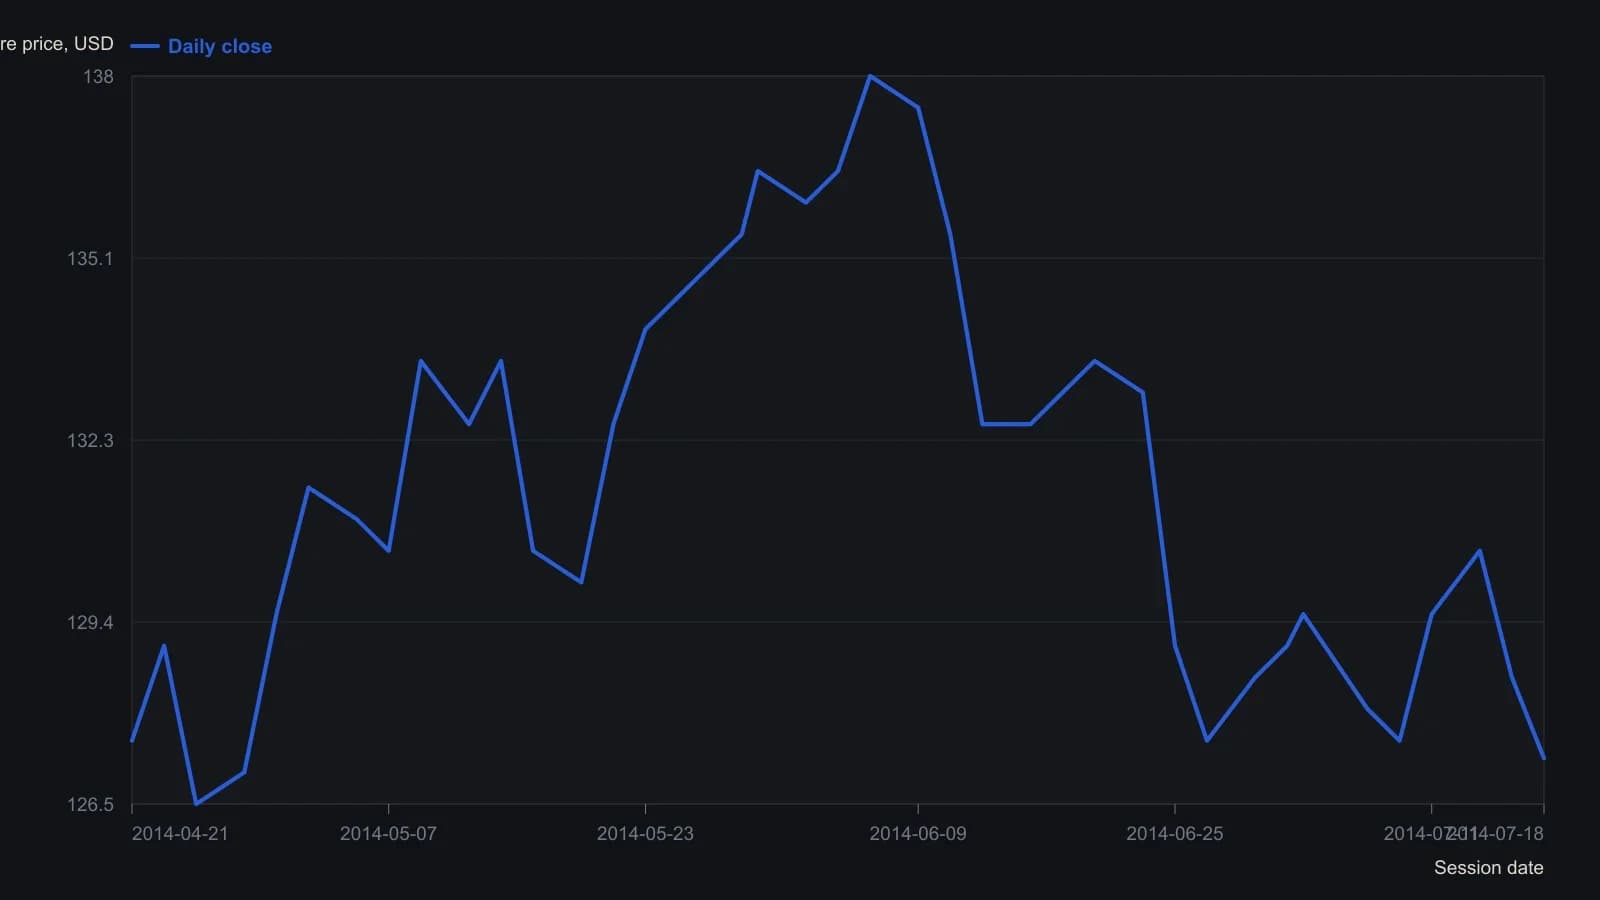
The 18 July last print is the figure header (127.22). Other closes were read from the published daily scale to the nearest half dollar; the raster does not support finer ticks. Volume stays in a separate pane on this chart and is not mixed onto the price axis.
The volume-scaled box
A volume-scaled chart replaces a uniform time axis with volume, so a heavier-volume month occupies more horizontal width than a lighter one. Each session is a volume-scaled box whose height is the high-low range and whose width is that session's volume.
Tall, thin volume-price boxes describe easy movement, the easy travel typical of trends. Short, wide boxes describe difficult movement, the sluggish travel often seen at tops. Extremely tall boxes on heavy volume are typical of panic lows.
Candle body and wicks
A candle body is the open-to-close span, with the remainder of the range drawn as wicks. Bodies tend to lengthen in trends, shrink in consolidations especially at tops, and become very large at lows.
Keep the box outline
Merging volume-scaled boxes with candlesticks while discarding the box outline removes the volume-shape cue that the volume-price construction is built to show.
The hybrid mark keeps the volume-defined box dimensions and paints the open and close inside that box, so all five session fields appear in one comparable entry.
Reading the hybrid mark
Narrow bodies inside very short volume boxes often mark tops. Same-direction bodies can string through declines or advances. Alternating colors in a range form a checkerboard. Important lows often show two neighboring tall, fairly wide opposite-color sessions.
The same mark across markets
The same hybrid construction is presented as applicable to individual equities, exchange-traded funds, market averages, and commodities.
On a hybrid spot-gold example, moves through support or resistance coincide with heavier volume, wider ranges, and large bodies. That combination is breakout confirmation. Quieter sessions show lighter volume, small ranges, and a partial fill, with the candle body occupying only part of the volume-scaled box.
All readings on this track · 54 readings
- 1990Constructing three-session rally and reaction volume signals
- 1991Constructing candlestick real bodies and multi-session patterns
- 1991Treat a candlestick reversal as incomplete until %D confirms it
- 1991Filtering candlestick signals with stochastic percent-D
- 1991Constructing compressed candlestick summaries
- 1993Intraday candlestick confirmation with oscillators
- 1993Candlestick hypotheses from a 1993 reading list
- 1994License candlestick signals with oscillators and weekly vetoes
- 1995Real-body support, resistance, and close-through breakouts
- 1997Weekly reversal as a three-part hypothesis
- 1998Turning fear levels into testable rules with a psychological matrix
- 2000Evaluating three-bar reversal reliability
- 2000Prior-day candles, open confirmation, and same-session stops
- 2000Intraday candlestick volume confirmation for daytrading
- 2001Count the key reversal up before coding a mechanical exit
- 2001Rising and falling three continuation candle construction
- 2002Treat a moving average as a contested fence
- 2003Candlestick signals need support and a risk-reward screen
- 2003Constructing one-day reversal tops and bottoms
- 2003Chart sentiment as a regime filter for hourly stochastic entries
- 2004Confirming index reversals with candlesticks, stochastics and averages
- 2004The harami inner close as a reversal barometer
- 2004Constructing a true-range volume power-shift filter
- 2005Weighing reversal clusters against moving-average support
- 2005Candlestick exits confirmed by overbought stochastics
- 2005Confirming piercing patterns with stochastics and moving averages
- 2006Candlestick cluster exits confirmed by overbought stochastics
- 2007Three black crows become a trade hypothesis only after regime, trend and nearby levels
- 2008Asymmetrical RSI lookbacks for divergence and candle confirmation
- 2008A permission checklist for the end of a trend
- 2010Mechanical entries still need confirmation gates
- 2010Crude oil as a case study in candlestick session reading
- 2010Gold weekly candles and the thousand resistance breakout
- 2010A three-layer gold chart drill from waves to candle confirmation
- 2011Why entry scans fail without trend filters
- 2011Price-zone oscillator trend-regime rules
- 2011A candlestick checklist before commodity entries
- 2013Step candle construction at price turning points
- 2013Two-bar step-candle construction
- 2014Small-range bars as a timed volume-climax hypothesis
- 2014Constructing volume-scaled candlestick charts
- 2015Weekly range midpoints as support and resistance
- 2015Constructing weekly body-midpoint pattern codes
- 2015Evaluating encoded candlestick sequence hypotheses
- 2015Constructing a breakout relative-strength index from two-day range candles
- 2016A three-gate classroom on hourly sterling
- 2016Fibonacci retracement as a pre-commitment stop map
- 2017Nine-zone filter for decade-level breakouts
- 2017Constructing pin-bar and inside-bar setups
- 2017Two-bar soldier and crow rules become a system only after filters and exits
- 2017Confirm a one-white-soldier or one-black-crow before entry
- 2018Session control from marubozu and engulfing geometry
- 2019Volume, acceleration, and candle filters on a completed double bottom
- 2019Sector-filtered candlestick scans and predrawn stops