2014issue C0228-30
Small-range bars as a timed volume-climax hypothesis
A small-range bar marks a brief, unstable balance of buying and selling. Editorial reading treats that bar as a timed hypothesis window, and treats the next volume expansion as the test of whether price is breaking out of the standoff or exhausting at a climax.
- A small-range bar, often a doji, is read as a short-lived buyer-seller balance that is not expected to persist.
- Near a high the bar is treated as a likely downward turn; near a low it is treated as a likely upward turn. A topping tail is read as control shifting to sellers, and a bottoming tail as control shifting to buyers.
- Rising price with rising volume is treated as confirmation that participation supports the move. A volume climax is presented as a possible start or end of a trend and is said to need later-bar or additional-indicator confirmation.
- In the illustrated case, a small-range bar with rising volume after a volume spike was labeled a bottom buy cue, and a later small-range bar with rising volume was labeled a top.
What a small-range bar marks
A small-range bar is a session whose open and close sit nearly together. It is interpreted as a short-lived balance of buying and selling that is not expected to persist. On candlestick charts those bars appear as dojis. When a doji forms near a high it is treated as a likely downward turn. When it forms near a low it is treated as a likely upward turn.
Small-range bars after an uptrend on high volume can mean buyers are hesitating at that level. After a downtrend on high volume they can mean sellers are hesitating.
Tails and named candlestick forms
A topping tail on a small-range bar is read as control shifting from buyers to sellers. A bottoming tail is read as control shifting from sellers to buyers.
Named candlestick variants of small-range bars include a dragonfly doji and a hammer as bullish forms; a gravestone doji, a shooting star, and a hanging man as bearish forms; and spinning tops as two-way change cues.
Volume confirmation and climax
Rising price with rising volume is treated as confirmation that participation supports the move. Rising price with falling volume is treated as a price-volume divergence that can precede a reversal.
A volume climax is high volume with a sharp advance or decline. It is presented as a possible start or end of a trend and is said to need later-bar or additional-indicator confirmation.
Price falling while volume rises is treated as possible panic selling or churning, and as a caution until the cause of the divergence is identified.
The illustrated case
In the illustrated case, a 2013-06-24 small-range bar (high 89.49, low 88.02, close 88.48) with rising volume after a 2013-06-21 volume spike (high 90.14, low 88.85, close 89.48) was labeled a bottom buy cue. Later receding volume while price rose was treated as a climax.
A later 2013-08-01 small-range bar (high 93.10, low 91.25, close 92.73) with rising volume was labeled a top. After that bar, declining volume was treated as a sell cue between 91.00 and 92.00.
Exxon Mobil daily close, March–October 2013
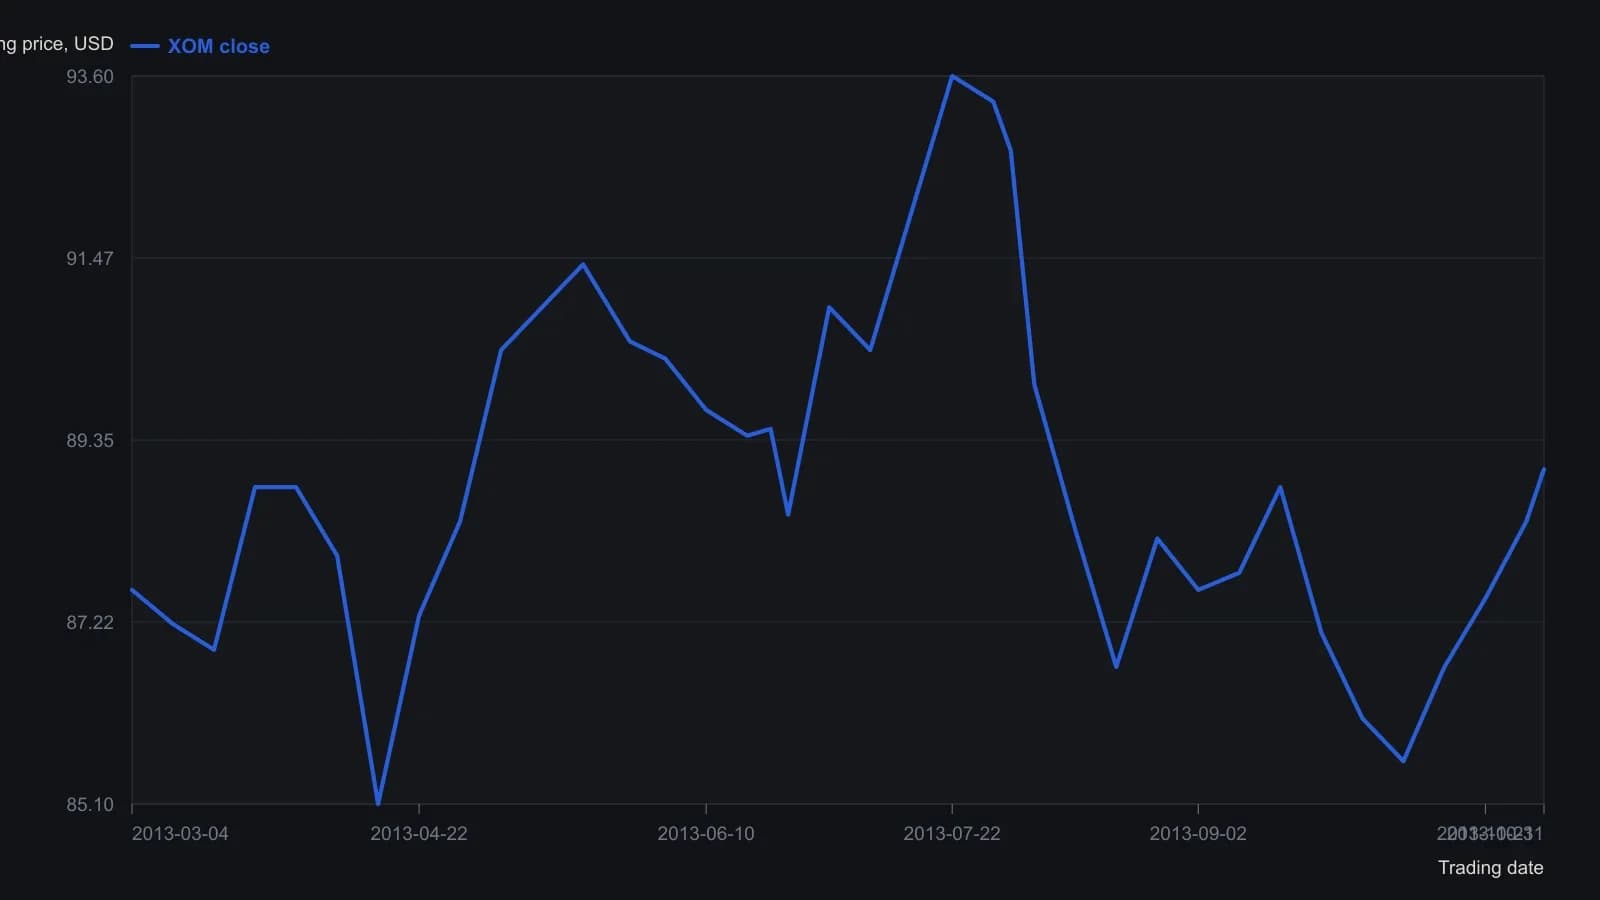
Unlabeled weekly closes are read to the nearest tenth of a dollar from the 0.50 price grid. The source also plots volume with a 60-day EMA near 12.5 million shares; that pane is omitted because it does not share the price scale.
All readings on this track · 54 readings
- 1990Constructing three-session rally and reaction volume signals
- 1991Constructing candlestick real bodies and multi-session patterns
- 1991Treat a candlestick reversal as incomplete until %D confirms it
- 1991Filtering candlestick signals with stochastic percent-D
- 1991Constructing compressed candlestick summaries
- 1993Intraday candlestick confirmation with oscillators
- 1993Candlestick hypotheses from a 1993 reading list
- 1994License candlestick signals with oscillators and weekly vetoes
- 1995Real-body support, resistance, and close-through breakouts
- 1997Weekly reversal as a three-part hypothesis
- 1998Turning fear levels into testable rules with a psychological matrix
- 2000Evaluating three-bar reversal reliability
- 2000Prior-day candles, open confirmation, and same-session stops
- 2000Intraday candlestick volume confirmation for daytrading
- 2001Count the key reversal up before coding a mechanical exit
- 2001Rising and falling three continuation candle construction
- 2002Treat a moving average as a contested fence
- 2003Candlestick signals need support and a risk-reward screen
- 2003Constructing one-day reversal tops and bottoms
- 2003Chart sentiment as a regime filter for hourly stochastic entries
- 2004Confirming index reversals with candlesticks, stochastics and averages
- 2004The harami inner close as a reversal barometer
- 2004Constructing a true-range volume power-shift filter
- 2005Weighing reversal clusters against moving-average support
- 2005Candlestick exits confirmed by overbought stochastics
- 2005Confirming piercing patterns with stochastics and moving averages
- 2006Candlestick cluster exits confirmed by overbought stochastics
- 2007Three black crows become a trade hypothesis only after regime, trend and nearby levels
- 2008Asymmetrical RSI lookbacks for divergence and candle confirmation
- 2008A permission checklist for the end of a trend
- 2010Mechanical entries still need confirmation gates
- 2010Crude oil as a case study in candlestick session reading
- 2010Gold weekly candles and the thousand resistance breakout
- 2010A three-layer gold chart drill from waves to candle confirmation
- 2011Why entry scans fail without trend filters
- 2011Price-zone oscillator trend-regime rules
- 2011A candlestick checklist before commodity entries
- 2013Step candle construction at price turning points
- 2013Two-bar step-candle construction
- 2014Small-range bars as a timed volume-climax hypothesis
- 2014Constructing volume-scaled candlestick charts
- 2015Weekly range midpoints as support and resistance
- 2015Constructing weekly body-midpoint pattern codes
- 2015Evaluating encoded candlestick sequence hypotheses
- 2015Constructing a breakout relative-strength index from two-day range candles
- 2016A three-gate classroom on hourly sterling
- 2016Fibonacci retracement as a pre-commitment stop map
- 2017Nine-zone filter for decade-level breakouts
- 2017Constructing pin-bar and inside-bar setups
- 2017Two-bar soldier and crow rules become a system only after filters and exits
- 2017Confirm a one-white-soldier or one-black-crow before entry
- 2018Session control from marubozu and engulfing geometry
- 2019Volume, acceleration, and candle filters on a completed double bottom
- 2019Sector-filtered candlestick scans and predrawn stops