2008issue C131-6
A permission checklist for the end of a trend
Elliott wave analysis first labels a completed trend as a five-wave impulse so a three-wave correction can be treated as the next expected structure. A six-item pre-trade checklist withholds a reversal plan until at least four independent checks agree. Candlestick patterns then time the first order only after that permission is granted.
- Frame a completed trend as a five-wave impulse so the expected next structure is a three-wave correction that later filters can test.
- Project wave-5 exhaustion as a channel zone with a 50% line and listed wave-1 measures, then confirm sequence with a 5/34/5 histogram and an 8/13/21/34 EMA stack.
- Read wedges, head-and-shoulders, and double or triple tops and bottoms as Elliott equivalents, not as a separate reversal system.
- Plan a reversal only when at least four of six checklist items agree, then wait for the market to turn and use candlestick reversals only with divergence, reversal structure, and the EMA filter.
Permission before a reversal plan
TradersWeek editorial reading: the end of a trend is a permission problem. Elliott wave analysis writes a falsifiable hypothesis. A pre-trade checklist withholds action until independent filters agree. Candlestick patterns may time the first order only after that permission is granted.
The archive workflow begins by framing a completed trend as a five-wave impulse, after which a three-wave correction is the expected next structure.
Elliott wave analysis writes the hypothesis
Elliott wave analysis labels five-wave impulses and three-wave corrections so a trend-ending hypothesis can be tested against later filters.
Wave-5 exhaustion is projected as a zone by connecting waves 2 and 4, drawing parallels from waves 1 and 3, and placing a 50% line between waves 1 and 3. A preliminary channel from waves 1, 2, and 3 is redrawn after wave 4 finishes so that wave 5 is expected to stay inside the updated channel zone.
Wave 5 is measured as 1.0, 0.618, 1.272, or 1.618 of wave 1, or as 0.618 of the span from the start of wave 1 to the end of wave 3.
Sequence checks that stay independent
A 5/34/5 histogram on about 100 to 140 bars is read for a wave-3 extreme, a wave-4 return to the zero line, wave-5 divergence, and whether the histogram sits above or below its five-bar signal line.
An 8/13/21/34 EMA stack marks an unfinished wave when price returns to the averages without piercing them. It marks sequence completion when the fastest average crosses the slower three after a close through the 21- and 34-period lines.
Rising or falling wedges, head-and-shoulders, and double or triple tops and bottoms are treated as Elliott equivalents: a diagonal, a 3-4-5-A-B-C, a failed fifth or 1-2, and stacked 1-2 counts.
A six-item pre-trade checklist
The pre-trade checklist is a six-item confirmation procedure that treats entry, abstention, and planning as one rule set. A reversal setup is not planned until at least four items agree. The trade then waits for the market to turn and uses predefined entries, stops, and more than one profit target.
Candlestick patterns as a timing filter
Candlestick patterns are one-to-five-bar reversal forms used as a timing filter after structure and momentum already agree. Candlestick reversals, including gapless morning-star, evening-star, engulfing, and tweezer forms, are used only together with oscillator divergence, reversal chart structure, and the EMA filter.
EUR/USD wave-5 targets versus the printed high
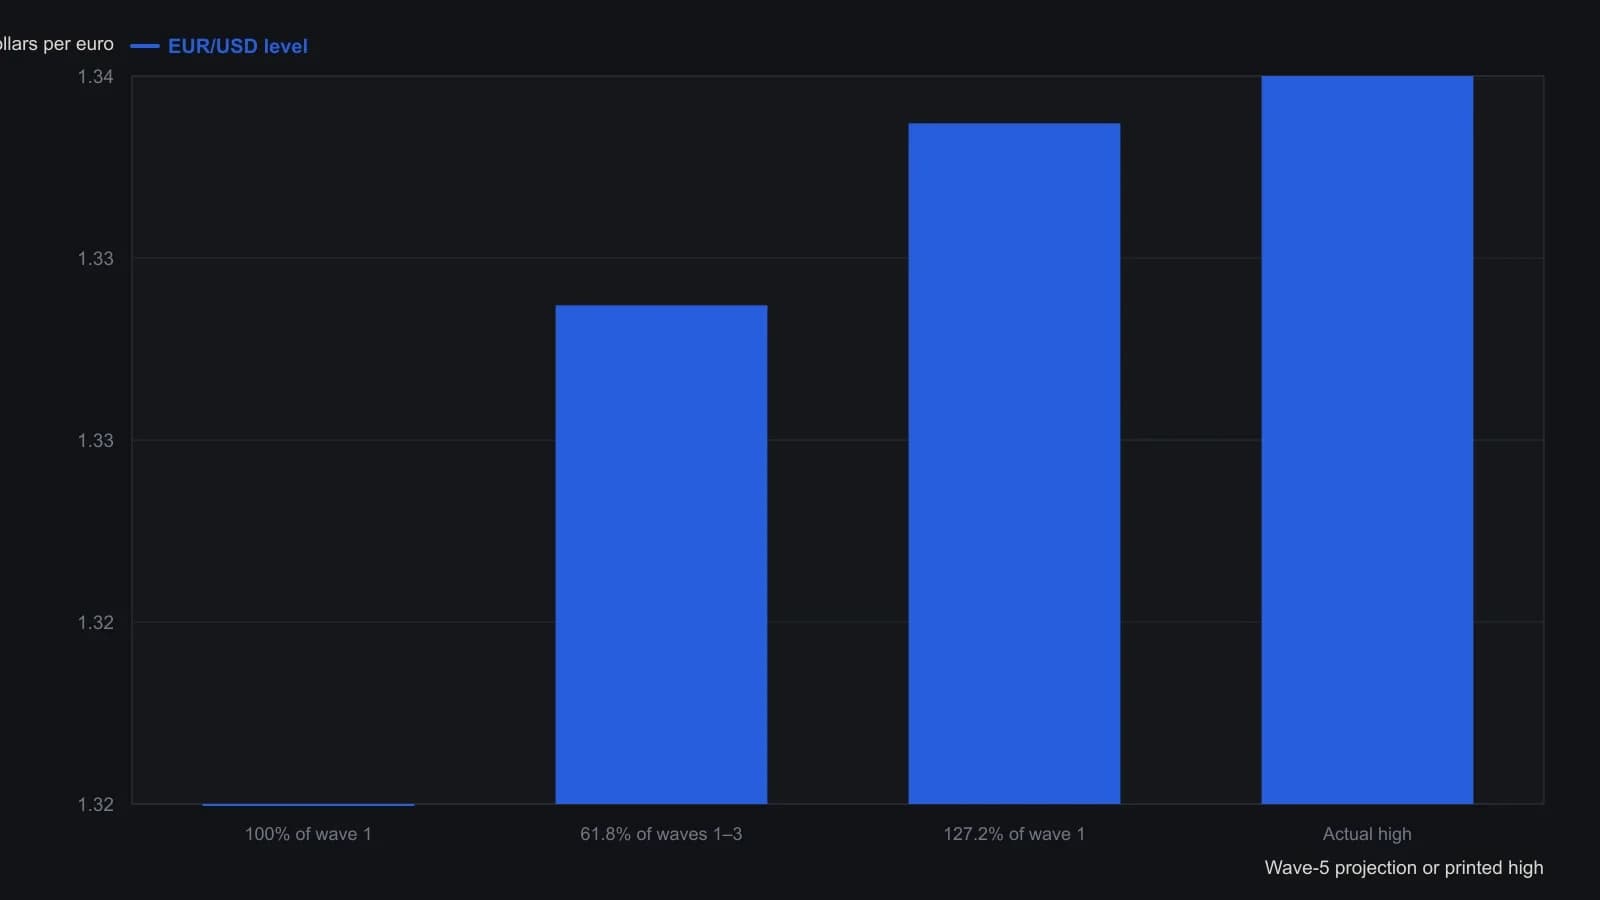
The four rates are the figures given for the November 2005–December 2006 weekly EUR/USD example; they are not candle-by-candle readings from the pane.
All readings on this track · 54 readings
- 1990Constructing three-session rally and reaction volume signals
- 1991Constructing candlestick real bodies and multi-session patterns
- 1991Treat a candlestick reversal as incomplete until %D confirms it
- 1991Filtering candlestick signals with stochastic percent-D
- 1991Constructing compressed candlestick summaries
- 1993Intraday candlestick confirmation with oscillators
- 1993Candlestick hypotheses from a 1993 reading list
- 1994License candlestick signals with oscillators and weekly vetoes
- 1995Real-body support, resistance, and close-through breakouts
- 1997Weekly reversal as a three-part hypothesis
- 1998Turning fear levels into testable rules with a psychological matrix
- 2000Evaluating three-bar reversal reliability
- 2000Prior-day candles, open confirmation, and same-session stops
- 2000Intraday candlestick volume confirmation for daytrading
- 2001Count the key reversal up before coding a mechanical exit
- 2001Rising and falling three continuation candle construction
- 2002Treat a moving average as a contested fence
- 2003Candlestick signals need support and a risk-reward screen
- 2003Constructing one-day reversal tops and bottoms
- 2003Chart sentiment as a regime filter for hourly stochastic entries
- 2004Confirming index reversals with candlesticks, stochastics and averages
- 2004The harami inner close as a reversal barometer
- 2004Constructing a true-range volume power-shift filter
- 2005Weighing reversal clusters against moving-average support
- 2005Candlestick exits confirmed by overbought stochastics
- 2005Confirming piercing patterns with stochastics and moving averages
- 2006Candlestick cluster exits confirmed by overbought stochastics
- 2007Three black crows become a trade hypothesis only after regime, trend and nearby levels
- 2008Asymmetrical RSI lookbacks for divergence and candle confirmation
- 2008A permission checklist for the end of a trend
- 2010Mechanical entries still need confirmation gates
- 2010Crude oil as a case study in candlestick session reading
- 2010Gold weekly candles and the thousand resistance breakout
- 2010A three-layer gold chart drill from waves to candle confirmation
- 2011Why entry scans fail without trend filters
- 2011Price-zone oscillator trend-regime rules
- 2011A candlestick checklist before commodity entries
- 2013Step candle construction at price turning points
- 2013Two-bar step-candle construction
- 2014Small-range bars as a timed volume-climax hypothesis
- 2014Constructing volume-scaled candlestick charts
- 2015Weekly range midpoints as support and resistance
- 2015Constructing weekly body-midpoint pattern codes
- 2015Evaluating encoded candlestick sequence hypotheses
- 2015Constructing a breakout relative-strength index from two-day range candles
- 2016A three-gate classroom on hourly sterling
- 2016Fibonacci retracement as a pre-commitment stop map
- 2017Nine-zone filter for decade-level breakouts
- 2017Constructing pin-bar and inside-bar setups
- 2017Two-bar soldier and crow rules become a system only after filters and exits
- 2017Confirm a one-white-soldier or one-black-crow before entry
- 2018Session control from marubozu and engulfing geometry
- 2019Volume, acceleration, and candle filters on a completed double bottom
- 2019Sector-filtered candlestick scans and predrawn stops