1995issue C061-6
Real-body support, resistance, and close-through breakouts
A candlestick period is drawn from open, high, low, and close, with the real body as the open-to-close span. Mapping clustered real-body highs and lows as support and resistance separates a failed pierce from a later close through the body.
- The real body is the open-to-close rectangle of a candle period; shadows mark any extreme beyond that span.
- Support and resistance can be marked from clustered real-body lows and highs instead of session lows and highs.
- A later session may trade through a prior real-body extreme and still fail the level if it closes back on the original side of that body.
- A break of real-body support or resistance is counted only after a later real body closes through the level.
What a real body records
A candlestick period is drawn from open, high, low, and close, with the open-to-close span as the real body and any extreme beyond that span as a shadow.
A real body is filled when the open is above the close and left open when the close is above the open. Equal open and close produce a doji drawn as one horizontal line.
Editorial: treat the real body as the accepted print of the period and the shadow as rejected exploration beyond that print. A missing wick is a shaved candle.
Real-body support and resistance
Candlestick construction can be applied to a Western support-and-resistance map by marking clustered real-body highs and lows instead of session highs and lows.
Real-body support is a support area marked by clustered real-body lows rather than by session lows. Real-body resistance is a resistance area marked by clustered real-body highs rather than by session highs.
Real-body support and resistance bands are narrower than high-low bands, so a close-through test can be stated earlier than the same test measured at the wicks.
Close-through as the breakout count
A break of real-body support or resistance is counted only after a later real body closes through the level.
A close-through breakout is a penetration of a real-body level counted only after a later real body closes through that level, not after a trade through the body that later closes back on the original side.
Real-body resistance: failed pierces and a close-through
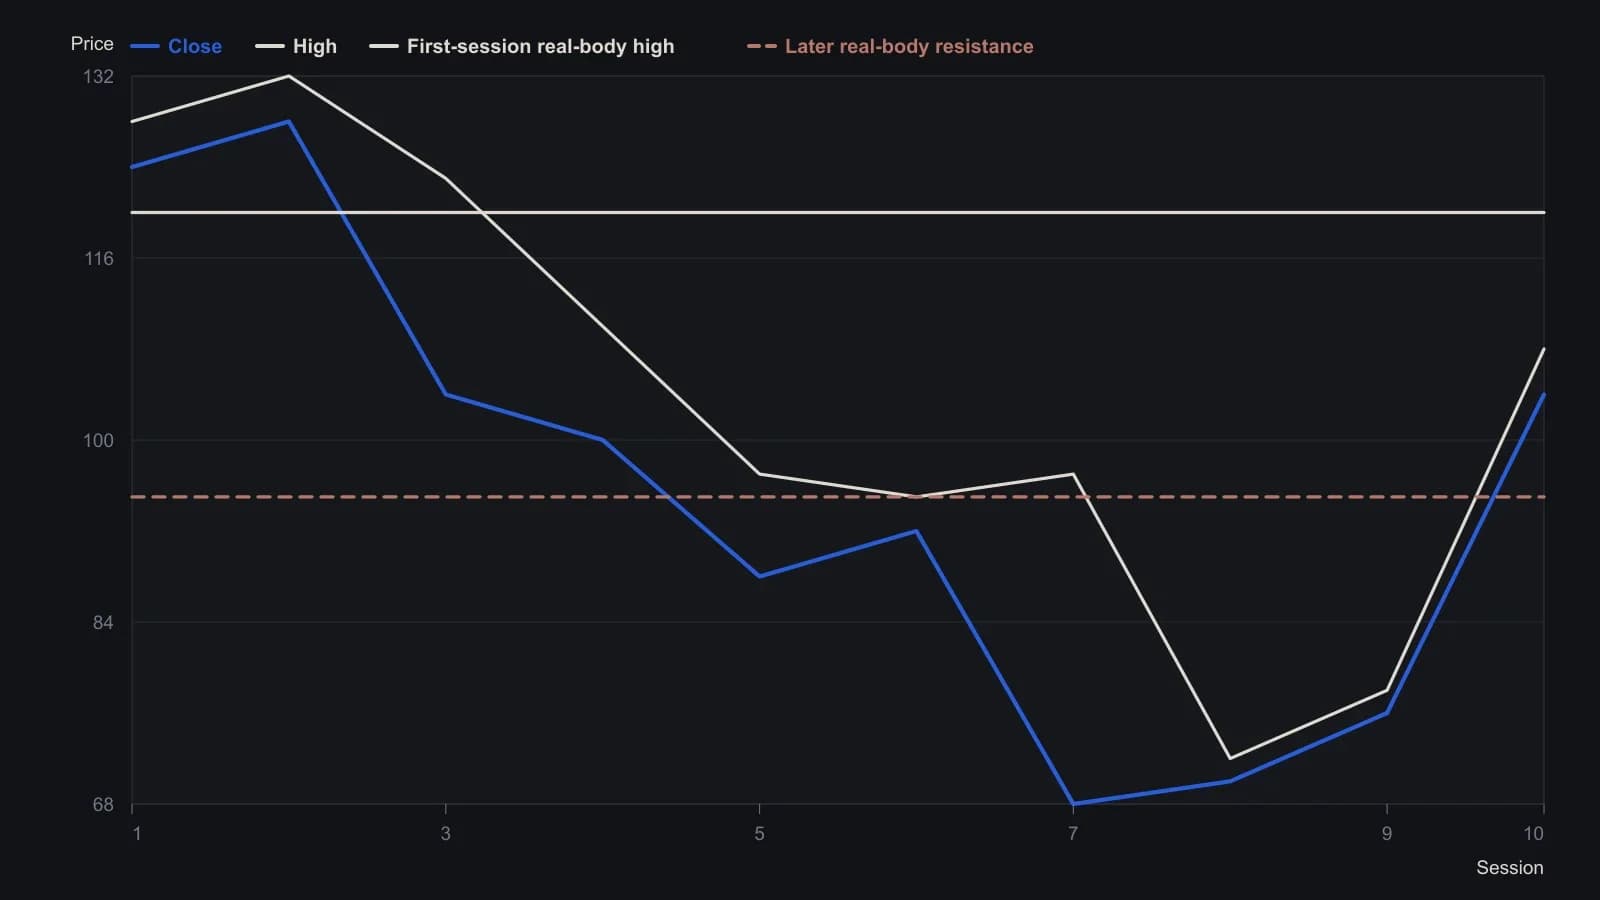
The pane is an unlabeled teaching schematic, not a named contract. Prices are approximate to the nearest few points, which is as fine as the printed scale will support.
Age, approach, and repeated touches
Levels only a few sessions old are described as fade tests on an intraday pierce, while older, more distant levels are described as approach tests that need not wait for a close-through.
Repeated touches increase a real-body level's importance, yet several slight penetrations also raise the chance that the next close-through is a genuine breakout.
Reversal shapes and how the map is used
Isolated candle reversal shapes, including tweezers and shooting-star forms, are treated as incomplete in a strong trend and as context that can argue against fading a nearby real-body level. Tweezers are a two-peak candlestick pairing used as a double-top analogue. A shooting-star is a candlestick reversal shape used as a warning before a later breakdown.
The same real-body map is described as supplying short-horizon counteraction tests, earlier entries into longer-horizon positions, and earlier recognition of close-through breakouts inside a trend.
All readings on this track · 54 readings
- 1990Constructing three-session rally and reaction volume signals
- 1991Constructing candlestick real bodies and multi-session patterns
- 1991Treat a candlestick reversal as incomplete until %D confirms it
- 1991Filtering candlestick signals with stochastic percent-D
- 1991Constructing compressed candlestick summaries
- 1993Intraday candlestick confirmation with oscillators
- 1993Candlestick hypotheses from a 1993 reading list
- 1994License candlestick signals with oscillators and weekly vetoes
- 1995Real-body support, resistance, and close-through breakouts
- 1997Weekly reversal as a three-part hypothesis
- 1998Turning fear levels into testable rules with a psychological matrix
- 2000Evaluating three-bar reversal reliability
- 2000Prior-day candles, open confirmation, and same-session stops
- 2000Intraday candlestick volume confirmation for daytrading
- 2001Count the key reversal up before coding a mechanical exit
- 2001Rising and falling three continuation candle construction
- 2002Treat a moving average as a contested fence
- 2003Candlestick signals need support and a risk-reward screen
- 2003Constructing one-day reversal tops and bottoms
- 2003Chart sentiment as a regime filter for hourly stochastic entries
- 2004Confirming index reversals with candlesticks, stochastics and averages
- 2004The harami inner close as a reversal barometer
- 2004Constructing a true-range volume power-shift filter
- 2005Weighing reversal clusters against moving-average support
- 2005Candlestick exits confirmed by overbought stochastics
- 2005Confirming piercing patterns with stochastics and moving averages
- 2006Candlestick cluster exits confirmed by overbought stochastics
- 2007Three black crows become a trade hypothesis only after regime, trend and nearby levels
- 2008Asymmetrical RSI lookbacks for divergence and candle confirmation
- 2008A permission checklist for the end of a trend
- 2010Mechanical entries still need confirmation gates
- 2010Crude oil as a case study in candlestick session reading
- 2010Gold weekly candles and the thousand resistance breakout
- 2010A three-layer gold chart drill from waves to candle confirmation
- 2011Why entry scans fail without trend filters
- 2011Price-zone oscillator trend-regime rules
- 2011A candlestick checklist before commodity entries
- 2013Step candle construction at price turning points
- 2013Two-bar step-candle construction
- 2014Small-range bars as a timed volume-climax hypothesis
- 2014Constructing volume-scaled candlestick charts
- 2015Weekly range midpoints as support and resistance
- 2015Constructing weekly body-midpoint pattern codes
- 2015Evaluating encoded candlestick sequence hypotheses
- 2015Constructing a breakout relative-strength index from two-day range candles
- 2016A three-gate classroom on hourly sterling
- 2016Fibonacci retracement as a pre-commitment stop map
- 2017Nine-zone filter for decade-level breakouts
- 2017Constructing pin-bar and inside-bar setups
- 2017Two-bar soldier and crow rules become a system only after filters and exits
- 2017Confirm a one-white-soldier or one-black-crow before entry
- 2018Session control from marubozu and engulfing geometry
- 2019Volume, acceleration, and candle filters on a completed double bottom
- 2019Sector-filtered candlestick scans and predrawn stops