1989issue C051-5
Commodity advance-decline from delivery months
A commodity futures index can be rebuilt as a daily vote of listed delivery-month closes. The archive accumulates that basket-sum into a cumulative breadth line and charts it against the index for confirmation or divergence.
- A session advance-decline net is the count of higher closes minus lower closes, whether those closes are listed stocks or futures delivery months.
- The cumulative breadth line may begin at any seed, is plotted beside the daily index close, and treats shared higher or lower trends as confirmation.
- Inside one commodity, each delivery month is one vote. The daily commodity-market reading is the basket-sum of those nets across the 21-member futures index.
- Because a small uptick and a large advance both register as one equal-weight close, participation can lead or lag a concentrated index.
Session net and the running line
A session advance-decline net is the number of advancing closes minus the number of declining closes. In the archive workflow, 235 advances and 356 declines equal a net of -121.
The cumulative breadth line is a running total of those session nets and may start at any seed. A seed of 1,000 plus a session net of -121 equals 879, and adding a following net of +205 equals 1,084.
The running total is charted against a daily price-index close. Joint higher or lower trends count as confirmation. Opposite trends count as non-confirmation of market breadth.
Equal-weight closes and divergence
Because a close up a small increment and a close up several points each count as one advance, the tally is an equal-weight close. A rising breadth line with a lagging index can mark weak upside. A falling breadth line with a slower-falling index can mark residual strength.
Divergence is the case where the index and the breadth line disagree on a new high or a new low. The archive uses that disagreement as a warning that the price move may not be widely shared.
The equity illustration
In the illustrated equity episode, a July recovery high in the industrial average that the breadth line did not confirm was followed by a 180-point decline.
A later June-to-August drop in which the average held its May low while the line broke its May low was treated as a strength non-confirmation before a rally to new recovery highs.
Delivery-month votes and the basket-sum
A commodity analogue is formed by summing, each day, up-closing minus down-closing delivery months across all 21 members of the commodity futures price-index basket, then accumulating that daily net and charting it against the index. That daily market reading is the basket-sum of the per-commodity nets.
Per-commodity nets treat every delivery month as one vote. Seven corn months all closing higher contribute +7. Oats with two months higher and three lower contribute -1.
The 1988 commodity illustration
In the 1988 commodity illustration, May joint new yearly highs confirmed a broad rally. A late-June stall in the breadth line while the index edged higher was a minor divergence. July produced a string of non-confirmations, then a late-July confirmed downtrend of lower highs and lower lows.
Later autumn divergences included a breadth return to yearly highs the index could not match, an unconfirmed November index uptick, and unconfirmed new index lows in mid-November.
After that mid-November non-confirmation, the breadth line made new yearly highs while the index only surpassed August-September resistance. The archive frames the long-horizon split as negative, and the near-term joint advance as the reading to respect.
CRB futures index, 1988
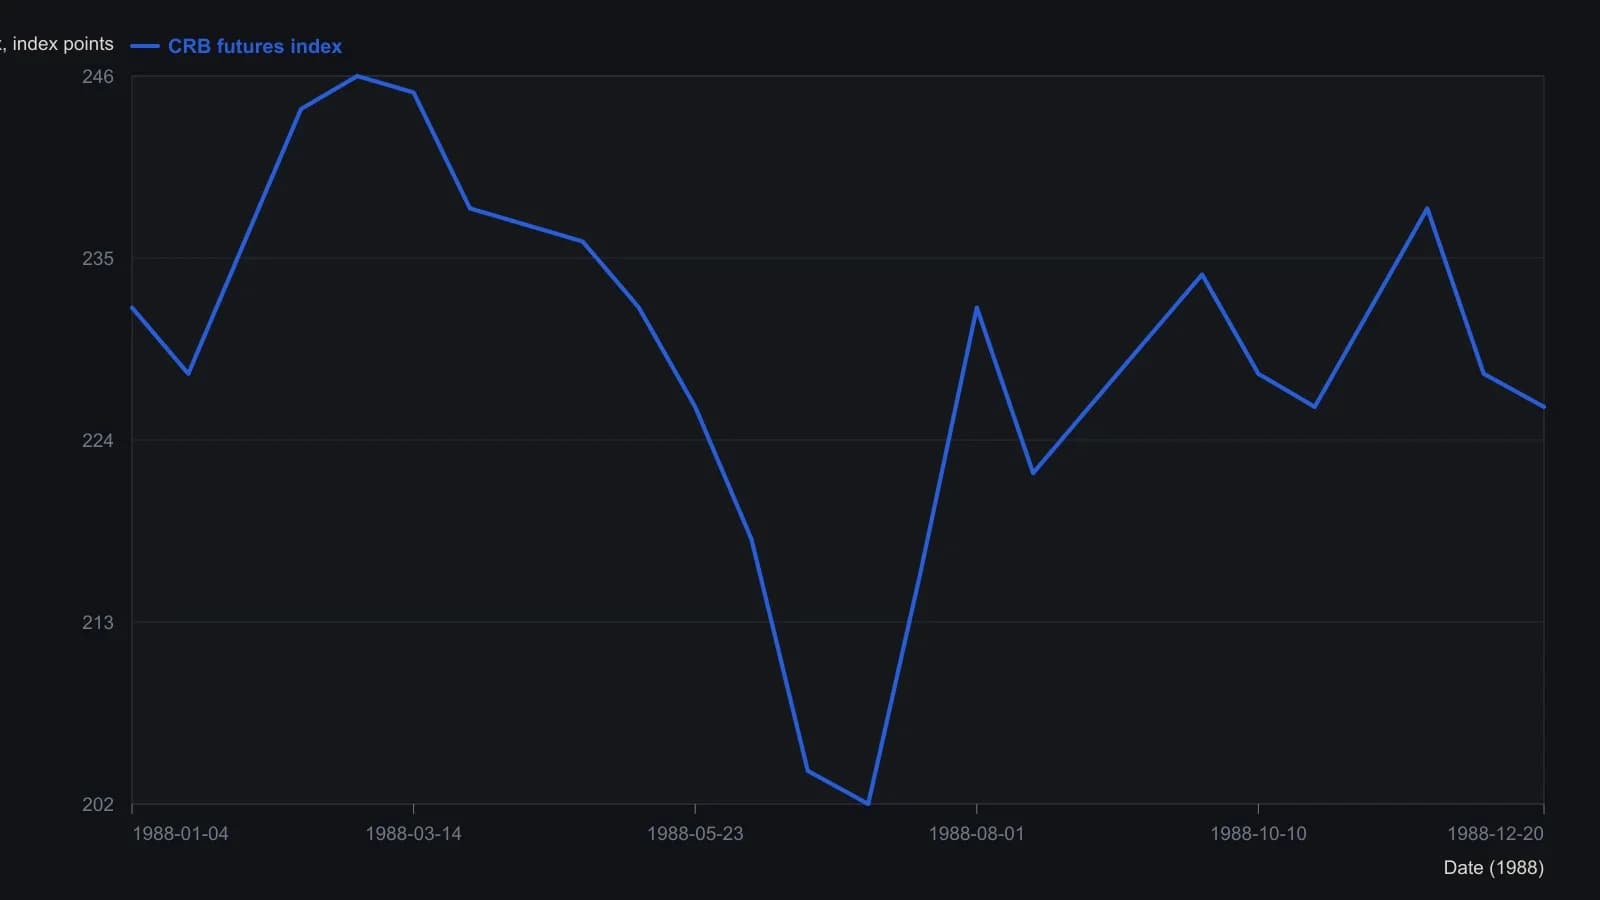
Values are approximate readings from the magazine raster, not a printed table. Tick marks on the source run 04-Jan through 20-Dec 1988. Point labels D, E, F, H and I follow the article. No more precision than the scan will bear.
All readings on this track · 40 readings
- 1988Constructing volume-confirmation overlays on OHLC spreadsheet charts
- 1989Commodity advance-decline from delivery months
- 1989The most-active list as a three-layer breadth lab
- 1989Constructing a yield-curve volume-breadth composite
- 1989A bond-futures case study in support, volume, and confirmation
- 1989Volume-scaled price boxes and volume cycles
- 1990Futures-signed on-balance volume construction
- 1990Self-relative volume boxes for news-free breakouts
- 1990Broadening swings, demand tests, and volume filters
- 1991A same-session pressure test of breadth and volume share
- 1991Tick extremes that confirm double tops and bottoms
- 1991Constructing auction fuel from volume and open interest
- 1994Constructing On-balance volume with smoothing and timeframe confirmation
- 1996A volume-gated moving-average trend combination
- 1996Constructing four-state range-volume bars
- 1997Failed trade review of a descending-triangle breakdown
- 1997Construct a head-and-shoulders before the neckline break
- 2004Volume confirmation is not optional for a head-and-shoulders reversal
- 2007Constructing a three-factor volume-price confirmation filter
- 2007Constructing a three-condition moving-average entry with a volume filter
- 2008Breakout rules that wait for volume and liquidity
- 2011Screen futures liquidity with open interest and volume
- 2011Filter executable futures with liquidity and open interest
- 2012Rank listed futures by liquidity before a forecast chooses the name
- 2012Filter futures liquidity using open interest and volume
- 2013Pre-trade futures liquidity as an execution filter
- 2014A futures liquidity screen from range, open interest and volume
- 2014Evaluating futures contract liquidity before execution
- 2014Constructing defended price lines from volume clusters
- 2014Filter futures by equal-dollar size, open interest, and volume
- 2015Filter futures ideas by ranked contract liquidity
- 2017Screen listed futures for execution liquidity first
- 2017Filter futures orders by liquidity, open interest, and volume
- 2018Using open interest and volume to rank futures liquidity
- 2018Score listed futures as an execution menu before the setup
- 2019Filtering futures orders with liquidity, open interest and volume
- 2019Futures liquidity as an execution filter
- 2020A futures liquidity board as a pre-trade execution filter
- 2020Sequenced volume and golden-cross breakout rules
- 2020Use a listed-futures liquidity filter before execution