1991issue C061-4
Tick extremes that confirm double tops and bottoms
A double high or low is only a working hypothesis when the same volume-scaled tick extreme appears at both tests. The later print, not the first crowd surge, is the one you can time and later falsify.
- Treat a double high or low as a working hypothesis only when an extreme-tick, scaled to that session's volume, appears at both tests.
- Time and later falsify the idea on the second-print-trigger, not on the first crowd surge that mapped the level.
- Read the tick-index as market-breadth: how widely the tape is ticking up versus down, not as a replacement for the price pattern.
- Use volume-confirmation so a busy session is not counted as crowded on a modest net tick print.
Why two prints are required
Intraday exchange tick readings were used to locate industrial-average turning points and to form buy or sell hypotheses lasting from one to ten days. The tick-index is the count of issues whose last print was higher than the prior print minus the count whose last print was lower. A tape with 500 upticks and 250 downticks therefore prints +250.
Editorial reading: market-breadth is used here as a crowd-position signal rather than a substitute for the price pattern. A double-top-bottom is only a working hypothesis when the same volume-scaled extreme-tick appears at both tests, so the second print, not the first crowd surge, is what you can time and later falsify.
Buy and sell hypotheses
A double-top-bottom is two tests of the same high or low, on the same session or within ten trading days, each tagged by an extreme-tick. The two tests of the same high or low could print on the same session or as far as ten trading days apart.
A sell hypothesis required a double high with an extreme positive tick print at each high, and the second extreme positive print was the trigger. A buy hypothesis required a double low with an extreme negative tick print at each low, and the second extreme negative print was the trigger.
How volume-confirmation sets the extreme
A tick print was judged extreme only relative to that session's volume: a busier tape required a larger net tick reading. The method treated a more extreme tick reading relative to volume as marking a more crowded one-way consensus and therefore a more important subsequent reversal hypothesis.
Editorial reading: volume-confirmation raises or lowers the extreme threshold with traded volume so a busy session is not misread as crowded on a modest tick print.
A documented pair of lows
One documented pair of lows used 890 downticks near 2470 on 191 million shares, then 880 downticks near 2465 on 121 million shares, with the second extreme treated as the buy trigger.
Editorial reading: the first extreme-tick mapped the low. The second-print-trigger is what started the buy hypothesis.
The working chart
The working chart stacked a daily industrial-average bar series above a companion series of each session's high-to-low tick-index range.
Editorial reading: the price pane shows the two tests of the same high or low. The tick-index range pane shows whether each test carried an extreme-tick.
Tick-index extremes at seven documented DJIA double tests
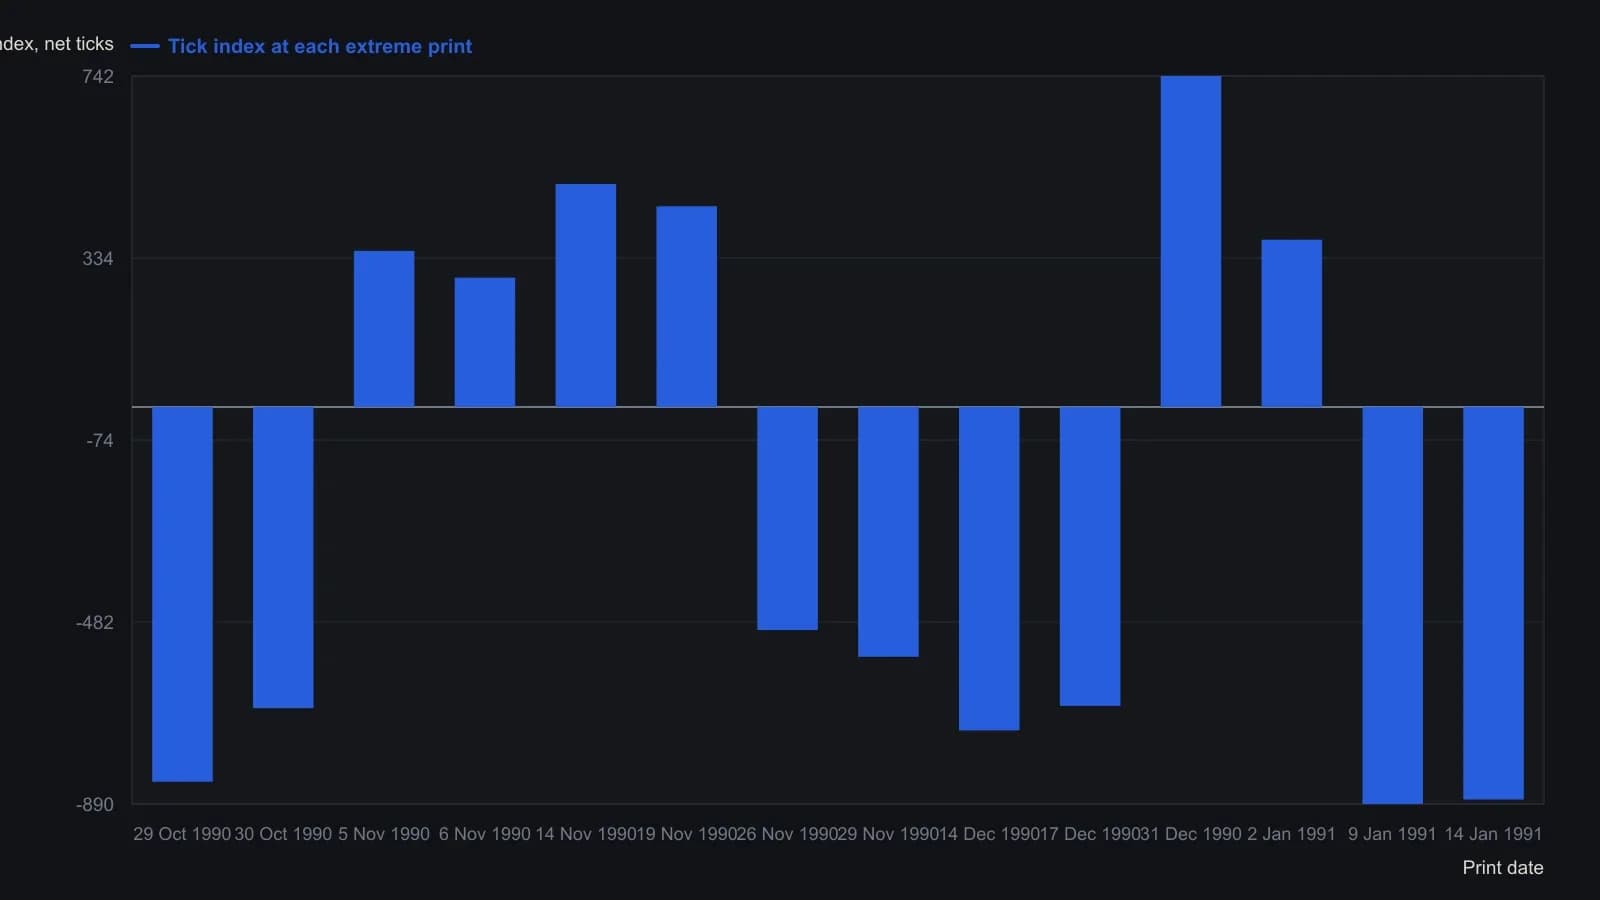
On 5 November 1990 the table lists three same-session uptick extremes (350, 325 and 300); only the first of those three is plotted. Volume confirmed every print as extreme. October–December dates are 1990; the January pair is 1991, as stated in the article.
All readings on this track · 40 readings
- 1988Constructing volume-confirmation overlays on OHLC spreadsheet charts
- 1989Commodity advance-decline from delivery months
- 1989The most-active list as a three-layer breadth lab
- 1989Constructing a yield-curve volume-breadth composite
- 1989A bond-futures case study in support, volume, and confirmation
- 1989Volume-scaled price boxes and volume cycles
- 1990Futures-signed on-balance volume construction
- 1990Self-relative volume boxes for news-free breakouts
- 1990Broadening swings, demand tests, and volume filters
- 1991A same-session pressure test of breadth and volume share
- 1991Tick extremes that confirm double tops and bottoms
- 1991Constructing auction fuel from volume and open interest
- 1994Constructing On-balance volume with smoothing and timeframe confirmation
- 1996A volume-gated moving-average trend combination
- 1996Constructing four-state range-volume bars
- 1997Failed trade review of a descending-triangle breakdown
- 1997Construct a head-and-shoulders before the neckline break
- 2004Volume confirmation is not optional for a head-and-shoulders reversal
- 2007Constructing a three-factor volume-price confirmation filter
- 2007Constructing a three-condition moving-average entry with a volume filter
- 2008Breakout rules that wait for volume and liquidity
- 2011Screen futures liquidity with open interest and volume
- 2011Filter executable futures with liquidity and open interest
- 2012Rank listed futures by liquidity before a forecast chooses the name
- 2012Filter futures liquidity using open interest and volume
- 2013Pre-trade futures liquidity as an execution filter
- 2014A futures liquidity screen from range, open interest and volume
- 2014Evaluating futures contract liquidity before execution
- 2014Constructing defended price lines from volume clusters
- 2014Filter futures by equal-dollar size, open interest, and volume
- 2015Filter futures ideas by ranked contract liquidity
- 2017Screen listed futures for execution liquidity first
- 2017Filter futures orders by liquidity, open interest, and volume
- 2018Using open interest and volume to rank futures liquidity
- 2018Score listed futures as an execution menu before the setup
- 2019Filtering futures orders with liquidity, open interest and volume
- 2019Futures liquidity as an execution filter
- 2020A futures liquidity board as a pre-trade execution filter
- 2020Sequenced volume and golden-cross breakout rules
- 2020Use a listed-futures liquidity filter before execution