2019issue C0458
Filtering futures orders with liquidity, open interest and volume
Treat a futures liquidity screen as a pre-trade execution gate. Drop contracts that fail open-interest and volume tests, then compare only the survivors after scaling them to an equal-dollar move so a margin percentage is not mistaken for fill quality.
- A liquidity filter is a pre-trade screen that keeps only contracts whose book, spread, volume and cost profile can support an executable order over the life of that order.
- Open-interest analysis and volume confirmation come first: outstanding inventory and a volume factor decide whether a name is active enough to keep.
- Compare surviving contracts with an equal-dollar contract count so each market sits on the same dollar footing, then read relative contract liquidity rather than raw margin.
- In the tabulated snapshot, the March 2019 S&P 500 E-Mini occupied the top relative-liquidity row, while the listed March 2019 bitcoin futures row showed no relative-liquidity dots.
A pre-trade execution gate
A futures liquidity rank is useful only if it answers a fill question: can this order be placed and worked over its life. Editorial: TradersWeek reads the historical screen as a gate, not as a ranking of attractiveness. First drop names that fail open-interest and volume tests. Then compare only the survivors after each one is scaled to an equal-dollar move.
The liquidity filter keeps contracts whose book, spread, volume and cost profile support an executable order. Names that fail those checks are not ranked against more active markets.
How the archive formed the rank
A futures liquidity rank was formed by multiplying contract point value, a three-year maximum price excursion, open interest and a volume factor typically between 1 and 4.
Relative contract liquidity ranked markets by the product of the equal-dollar contract count, total open interest and a volume factor. It is a descending rank of how readily a market’s full contract stock can be bought or sold.
Contracts showing one or no liquidity dots were described as having little activity.
Scale markets to an equal-dollar move
The equal-dollar contract count scaled every listed futures market by contract value times the largest three-year price change so figures in that column shared the same dollar footing.
That count is how many contracts of one market must be traded so its three-year dollar excursion matches that of another listed market. Editorial: after the open-interest and volume tests, this is the comparison that puts survivors on the same dollar footing. A margin percentage does not do that work.
Open interest and volume as size checks
Open-interest analysis uses outstanding contract inventory as a size input so a ranking reflects how much of the market is already open, not just recent prints.
Volume confirmation uses traded volume, including a volume adjustment, to check that apparent size is actually turning over rather than sitting idle.
That volume factor was the greater of 1 and the exponential of the natural log of volume divided by the natural log of 5000, minus 2. The factor typically sat between 1 and 4.
Effective percent margin is not fill quality
Effective percent margin was computed as dollar margin divided by the three-year dollar range of the contract, then multiplied by 100.
Editorial: a lower effective percent margin describes how large the posted margin is relative to the contract’s three-year dollar range. It does not say whether the order will fill cleanly. Use it after the liquidity filter, not instead of it.
What the tabulated snapshot showed
In the tabulated snapshot, the March 2019 S&P 500 E-Mini showed a 4.7 percent margin, a 15.2 effective percent margin and two contracts for an equal-dollar profit, and occupied the top relative-liquidity row.
The listed March 2019 bitcoin futures row showed a 44.1 percent margin and no relative-liquidity dots. Under the archive rule, one or no liquidity dots meant little activity.
Equity liquidity was framed as turnover: period volume expressed as a percentage of shares outstanding. Share-turnover is the equity proxy for trading liquidity, not a substitute for the futures rank.
Posted versus effective percent margin, April 2019 futures liquidity snapshot
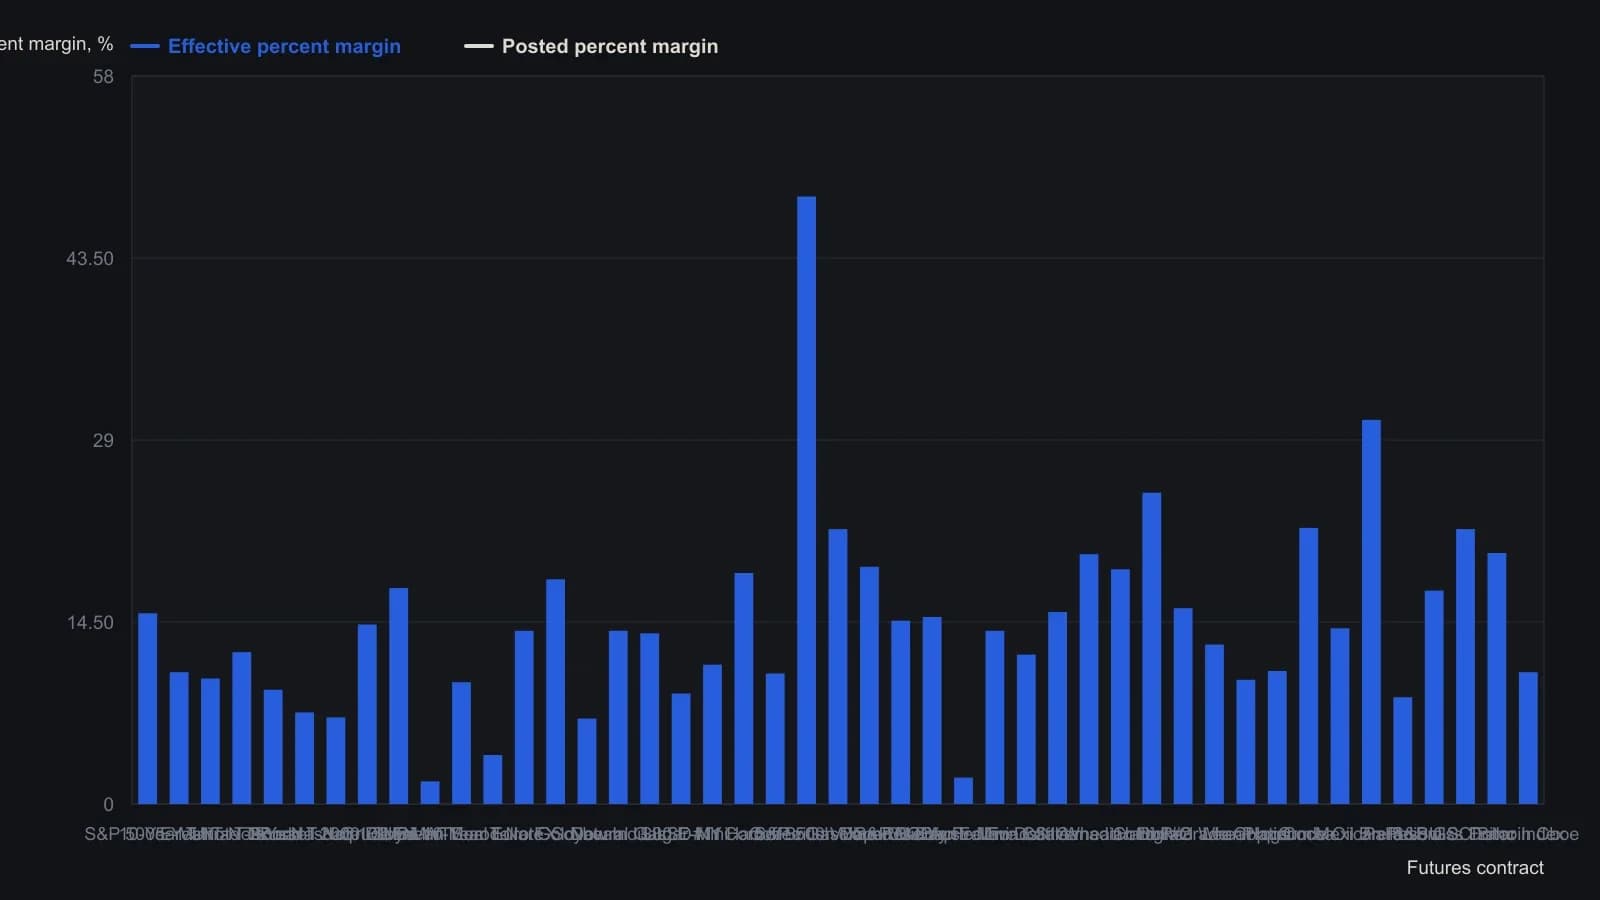
Effective percent margin is the source’s dollar margin divided by the three-year contract dollar range, times 100. Relative Contract Liquidity was printed only as a dot bar with no numeric scale, so it is not plotted. The trading-floor photograph carries no series.
All readings on this track · 40 readings
- 1988Constructing volume-confirmation overlays on OHLC spreadsheet charts
- 1989Commodity advance-decline from delivery months
- 1989The most-active list as a three-layer breadth lab
- 1989Constructing a yield-curve volume-breadth composite
- 1989A bond-futures case study in support, volume, and confirmation
- 1989Volume-scaled price boxes and volume cycles
- 1990Futures-signed on-balance volume construction
- 1990Self-relative volume boxes for news-free breakouts
- 1990Broadening swings, demand tests, and volume filters
- 1991A same-session pressure test of breadth and volume share
- 1991Tick extremes that confirm double tops and bottoms
- 1991Constructing auction fuel from volume and open interest
- 1994Constructing On-balance volume with smoothing and timeframe confirmation
- 1996A volume-gated moving-average trend combination
- 1996Constructing four-state range-volume bars
- 1997Failed trade review of a descending-triangle breakdown
- 1997Construct a head-and-shoulders before the neckline break
- 2004Volume confirmation is not optional for a head-and-shoulders reversal
- 2007Constructing a three-factor volume-price confirmation filter
- 2007Constructing a three-condition moving-average entry with a volume filter
- 2008Breakout rules that wait for volume and liquidity
- 2011Screen futures liquidity with open interest and volume
- 2011Filter executable futures with liquidity and open interest
- 2012Rank listed futures by liquidity before a forecast chooses the name
- 2012Filter futures liquidity using open interest and volume
- 2013Pre-trade futures liquidity as an execution filter
- 2014A futures liquidity screen from range, open interest and volume
- 2014Evaluating futures contract liquidity before execution
- 2014Constructing defended price lines from volume clusters
- 2014Filter futures by equal-dollar size, open interest, and volume
- 2015Filter futures ideas by ranked contract liquidity
- 2017Screen listed futures for execution liquidity first
- 2017Filter futures orders by liquidity, open interest, and volume
- 2018Using open interest and volume to rank futures liquidity
- 2018Score listed futures as an execution menu before the setup
- 2019Filtering futures orders with liquidity, open interest and volume
- 2019Futures liquidity as an execution filter
- 2020A futures liquidity board as a pre-trade execution filter
- 2020Sequenced volume and golden-cross breakout rules
- 2020Use a listed-futures liquidity filter before execution