2017issue C0258
Screen listed futures for execution liquidity first
Listed futures can be ranked by how readily outstanding contracts can be bought and sold. The archive workflow builds that order from an equal-dollar contract count, open interest, and a volume adjustment, and it treats the densest activity marks as the most active execution settings.
- A liquidity filter ranks listed futures by how readily size can be put on and taken off, using range, outstanding contracts, and activity rather than the attractiveness of a signal.
- Relative contract liquidity multiplies an equal-dollar contract count by total open interest and a volume factor that floors at 1 and compares volume to a 5,000-contract baseline.
- Each comparison column is a proportional measure and is interpretable only against other entries in the same column.
- In the 2017 snapshot, equity-index, Treasury-note, and WTI crude contracts occupied the densest liquidity ranks, while several smaller agricultural, currency, and metal contracts carried only a single activity mark.
What a liquidity filter ranks
A liquidity filter is a pre-trade screen that ranks listed futures by how readily size can be put on and taken off, using range, outstanding contracts, and activity rather than the attractiveness of a signal.
A listed-futures liquidity rank can be formed by multiplying contract point value, a three-year maximum price swing, open interest, and a volume adjustment typically between 1 and 4. The ranking treats the densest activity marks as the most active execution settings and treats a market with one mark or none as thinly traded.
How relative contract liquidity is built
An equal-dollar contract count scales each market by contract value times the largest three-year price change so every count represents the same dollar opportunity unit. It is the number of contracts needed so that tick value times a three-year maximum price swing matches the same dollar opportunity unit as another market.
Open interest analysis uses the stock of outstanding futures as a size-of-market input when judging whether an order is executable. Volume confirmation checks that recent activity is large enough to support the liquidity rank, including a floor of 1 and an exponential comparison of volume to a 5,000-contract baseline.
Relative contract liquidity equals that equal-dollar contract count times total open interest times a volume factor defined as the greater of 1 or exp(ln volume / ln 5000) minus 2. The score is descending and comparable across listed futures as a measure of how easily a market's outstanding contracts can be bought or sold.
Effective percent margin is dollar margin divided by the three-year dollar range of the contract, then multiplied by 100. It is used to compare capital locked per unit of historical range.
How to read the comparison
Each column in the comparison is a proportional measure and is interpretable only against other entries in the same column.
Markets at the top of the relative-liquidity order are those whose outstanding contracts are easiest to buy and sell; markets at the bottom are the hardest.
A 2017 snapshot and a share-turnover check
In the 2017 snapshot, equity-index, Treasury-note, and WTI crude contracts occupy the densest liquidity ranks, while several smaller agricultural, currency, and metal contracts carry only a single activity mark.
For listed shares, period volume as a percentage of shares outstanding is presented as a turnover-rate proxy for trading liquidity.
Equal-dollar contract counts in the February 2017 liquidity ranking
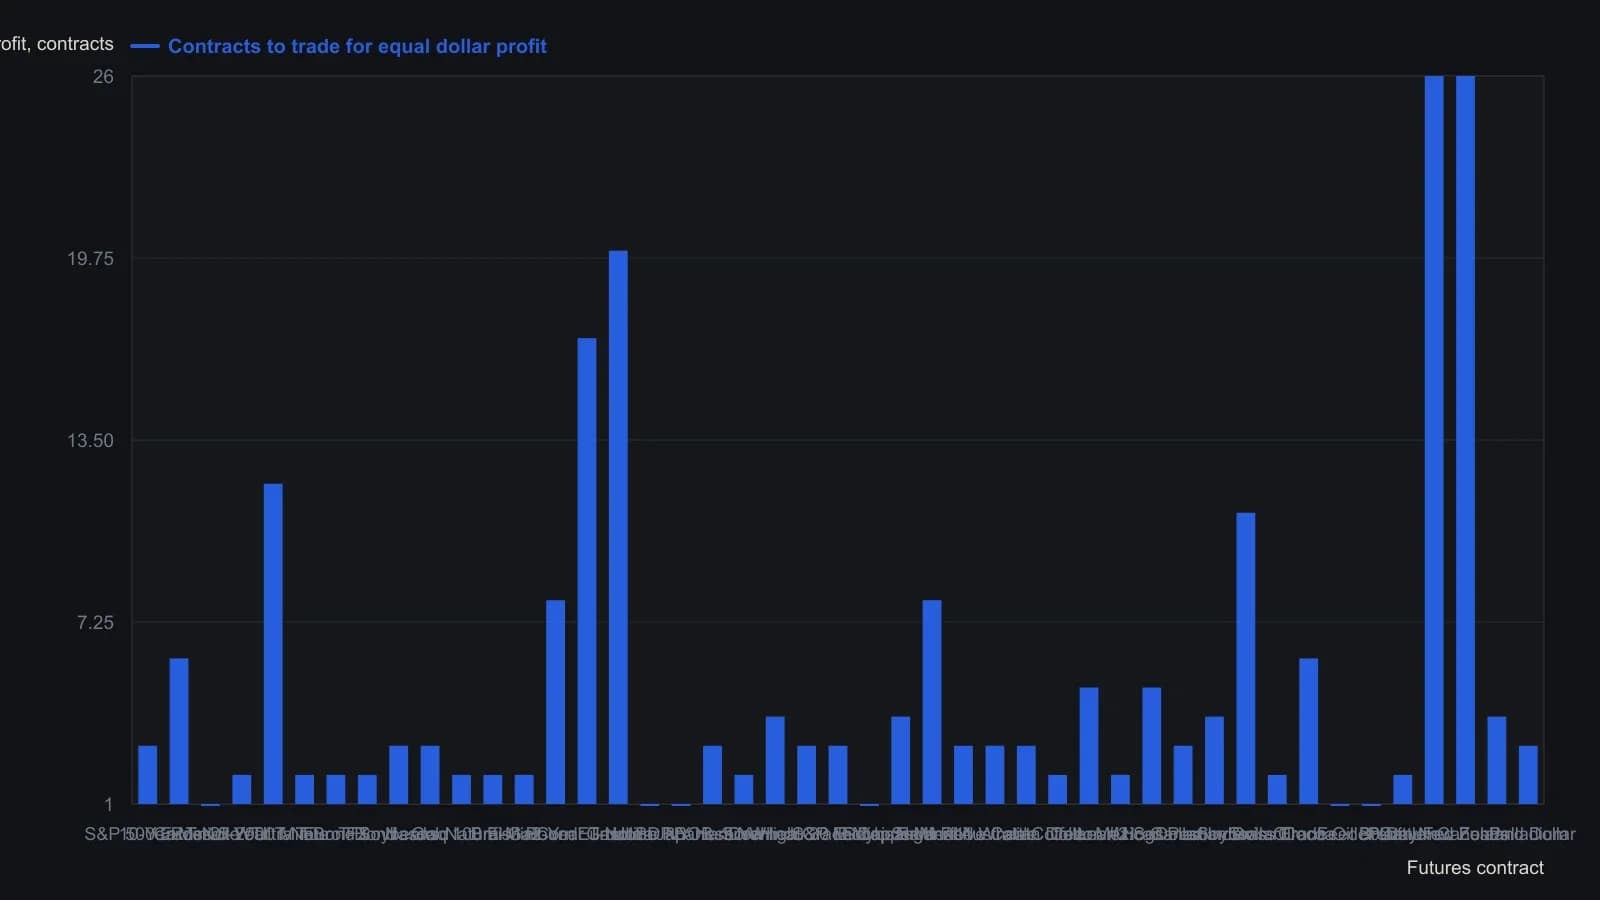
Contracts to trade equals tick dollar value times the three-year maximum price excursion; every name is weighted equally in that column. Relative contract liquidity itself was printed only as a dot bar (with overflow marks on the top names), so this series is the equal-dollar count, not a digitised dot score. Front months are those listed in the February 2017 snapshot, mostly March 2017.
All readings on this track · 40 readings
- 1988Constructing volume-confirmation overlays on OHLC spreadsheet charts
- 1989Commodity advance-decline from delivery months
- 1989The most-active list as a three-layer breadth lab
- 1989Constructing a yield-curve volume-breadth composite
- 1989A bond-futures case study in support, volume, and confirmation
- 1989Volume-scaled price boxes and volume cycles
- 1990Futures-signed on-balance volume construction
- 1990Self-relative volume boxes for news-free breakouts
- 1990Broadening swings, demand tests, and volume filters
- 1991A same-session pressure test of breadth and volume share
- 1991Tick extremes that confirm double tops and bottoms
- 1991Constructing auction fuel from volume and open interest
- 1994Constructing On-balance volume with smoothing and timeframe confirmation
- 1996A volume-gated moving-average trend combination
- 1996Constructing four-state range-volume bars
- 1997Failed trade review of a descending-triangle breakdown
- 1997Construct a head-and-shoulders before the neckline break
- 2004Volume confirmation is not optional for a head-and-shoulders reversal
- 2007Constructing a three-factor volume-price confirmation filter
- 2007Constructing a three-condition moving-average entry with a volume filter
- 2008Breakout rules that wait for volume and liquidity
- 2011Screen futures liquidity with open interest and volume
- 2011Filter executable futures with liquidity and open interest
- 2012Rank listed futures by liquidity before a forecast chooses the name
- 2012Filter futures liquidity using open interest and volume
- 2013Pre-trade futures liquidity as an execution filter
- 2014A futures liquidity screen from range, open interest and volume
- 2014Evaluating futures contract liquidity before execution
- 2014Constructing defended price lines from volume clusters
- 2014Filter futures by equal-dollar size, open interest, and volume
- 2015Filter futures ideas by ranked contract liquidity
- 2017Screen listed futures for execution liquidity first
- 2017Filter futures orders by liquidity, open interest, and volume
- 2018Using open interest and volume to rank futures liquidity
- 2018Score listed futures as an execution menu before the setup
- 2019Filtering futures orders with liquidity, open interest and volume
- 2019Futures liquidity as an execution filter
- 2020A futures liquidity board as a pre-trade execution filter
- 2020Sequenced volume and golden-cross breakout rules
- 2020Use a listed-futures liquidity filter before execution