1992issue C091-8
Critiquing unconfirmed Dow rallies with volume
When industrials print new highs while transports lag and rally volume thins, the archive treats the primary-trend story as unconfirmed. This article reconstructs that 1991-1992 confirmation workflow and labels a three-check critique as editorial.
- A market move is treated as strong only when industrial and transportation averages confirm each other in direction; opposite movement is a weakness cue that can precede a change.
- Volume confirmation is a filter: expanding volume on upside breaks supports an advance, and expanding volume on declines supports weakness.
- Divergence is a split in direction between the two averages, treated as a weakness cue that can precede a secondary setback or a primary-trend change.
- Editorial view: if industrials print new highs while transports lag and rally volume thins, treat the primary-trend claim as unconfirmed, not as a forecast of continuation or reversal.
A three-check reading of trend quality
The archive workflow judges trend quality by whether the industrial and transportation averages travel together, and by whether volume confirms the side that is breaking. Dow Theory, in this usage, is a price-structure reading of market direction from those two averages. They must travel together across primary, secondary, and tertiary time scales.
TradersWeek editorial framing groups the same tests into three checks: mutual direction of the averages, volume confirmation on rallies and declines, and divergence when the averages split. The editorial rule is narrow. If industrials print new highs while transports lag and rally volume thins, treat the primary-trend story as unconfirmed. Do not treat that state as a forecast of continuation or of reversal.
How the archive sorts price and volume
A market move is treated as strong only when industrial and transportation averages confirm each other in direction. Opposite movement is treated as a weakness cue that can precede a change. That split in direction is a divergence. It is treated as a weakness cue that can precede a secondary setback or a primary-trend change.
Price action is sorted into a primary trend lasting months or years, a contrary secondary trend lasting from a day or two to several weeks, and a tertiary day-to-day series. A sideways band of about 5 percent around a typical level is labeled forming a line. Its character is inferred from whether volume expands on upside breaks or on declines.
Volume confirmation is the filter on that break. Expanding volume on upside breaks is treated as supportive of an advance. Expanding volume on declines is treated as supportive of weakness.
The 1991 confirmed primary advance
In 1991 the industrial average rose about 800 points and the transportation average rose more than 400 points from the October 1990 lows. That pairing is presented as mutual confirmation of a continuing primary advance.
Through 1991, volume expanded on the mid-February rally and later advances and contracted on secondary declines. That pattern is treated as bullish volume confirmation.
The 1992 confirmation gap
First-half 1992 industrials advanced, including a late April-May move to new highs, while transports failed to match and were down from mid-February. That confirmation gap is read as weakness.
Divergences in late January and March 1992 are offered as a possible prior cue for the March-April correction, after which both averages appeared to find support.
1992 first-half Dow industrials versus transports
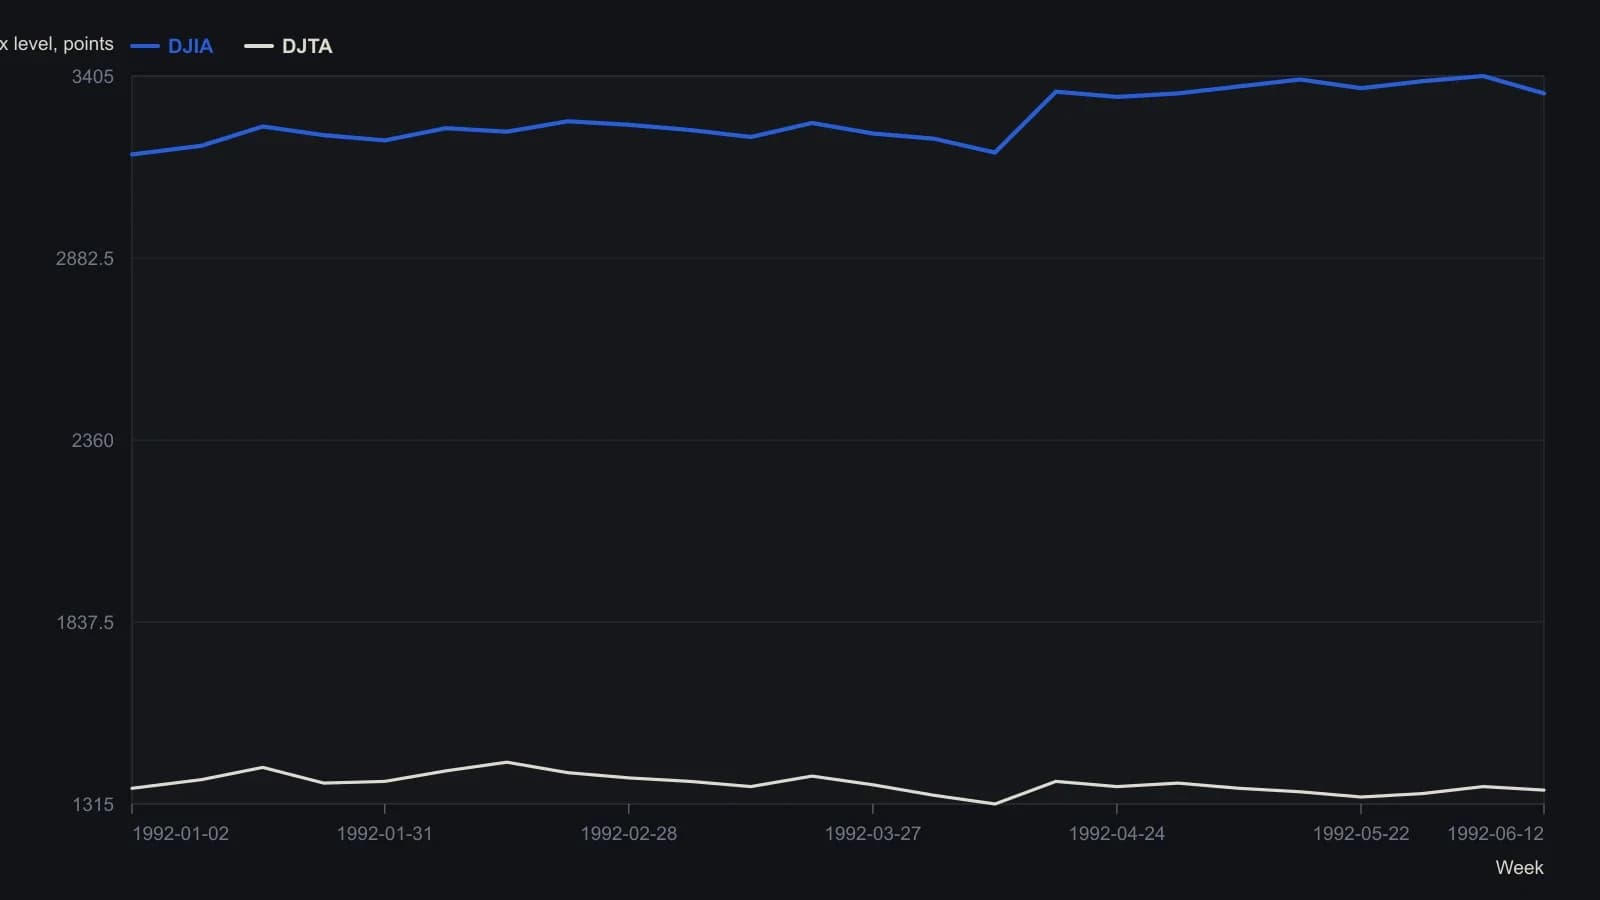
Both series were read off a rotated dual-axis raster (DJIA left scale, DJTA right scale) for 2 January–15 June 1992. Levels are approximate to the printed grid; do not treat tenths as printed precision.
Rally volume after the April surge
Early April 1992 saw a volume surge near 200 million shares on a correction, then an industrial breakout above 3300. From May onward, volume rarely exceeded about 200 million shares, and a drop below 150 million is flagged as more concerning.
The mid-1992 commentary treats a later decline as more likely unless transportation confirmation improves and rally volume expands. It also notes that confirmation can reappear suddenly, as it did in late 1991.
A barometer of direction, not a precise predictor
The framework is described as a barometer of direction and of strength or weakness rather than a precise predictor. It is described as still usable if the same confirmation conditions can be observed after turnover rose from about a million shares a year to as much as 100 million shares on a slow day.
Editorial close: keep the three checks in that order. Mutual direction of the averages comes first, volume confirmation sorts whether a break or a line looks like strength or weakness, and divergence flags an unconfirmed primary-trend story. None of those checks is treated here as a stand-alone forecast.
All readings on this track · 29 readings
- 1982A bounded-risk entry separates a forecast from a trend
- 1984Critiquing reward bias, single-scale charts, and exact-turn forecasts
- 1990Constructing dual-average primary-trend confirmation
- 1991Two-average confirmation before a primary reversal call
- 1991Delayed confirmation is not Dow Theory divergence
- 1991Confirmation delay and breadth divergence in a two-average case
- 1992Utilities as a rate-regime lead for equities
- 1992Critiquing unconfirmed Dow rallies with volume
- 1993When Dow Theory signals fail after the decision-makers change
- 1994Market life expectancy as a risk filter
- 1994Score industrial and transport sync before calling an intermediate-trend signal
- 1997A 1995 industrial-average breakout mapped from component trends
- 1998Confirm Dow trends with Market breadth and Head and shoulders
- 1999Confirming an equity idea with rate, commodity, and index spreads
- 2001Why trend, range, and Dow rules need separate tests
- 2001Bear-market confirmation via prior correction troughs
- 2002Constructing a Dow line before breakout confirmation
- 2002Two-average confirmation as a swing-by-swing classroom drill
- 2002Withhold the hypothesis until the second average confirms: a 2001 case
- 2002A primary-bear case study in cycle speed, Dow theory, and pattern legs
- 2003Four index proxies as a bear-regime dashboard
- 2004Dual-average confirmation at shared prior highs
- 2004Confirmation as the second clock on a trend break
- 2004The confirmation-reaction planning window after a joint break
- 2005Dow confirmation as a two-average trend test
- 2008Related-average confirmation lag after a correction
- 2008Intermediate confirmation outranks secular phasing
- 2012Align swings to nested energy regimes
- 2016From nonconfirmation to a bearish primary trend change