1988issue C091-8
Constructing intraday trade-facilitation percentile tables
A same-session trade-facilitation score is assembled from three historical percentile ladders: cumulative half-hour time-price prints, ticks traversed, and their ratio. Official volume stays out of the live tables and is applied after the close as a fourth confirmation.
- A same-session facilitation score is built from running time-price opportunities, ticks traversed, and their ratio, so the session can be graded before it closes.
- Historical ladders came from 210 Treasury-bond auction-report days, sorted on the final-period total, averaged in groups of 10, and mapped to a 0-100 percent scale in 5 percent steps.
- Split readings are treated as alerts rather than a single grade, and official volume is reserved as a fourth after-close confirmation.
- The same arithmetic can be rebuilt for other futures once historical half-hour profiles exist.
What trade facilitation is measuring
Trade facilitation is whether an auction is still hosting two-sided participation, as opposed to drying up through a shrinking range and heavier time spent on each price. Sessions that stop facilitating trade over several days are described as showing falling volume, a narrowing range, and a rising number of time-price prints on each price increment.
A same-session facilitation measure is constructed from two running within-day counts: time-price opportunities and ticks traversed, with a third reading formed from their ratio. The market profile is the lettered half-hour price structure from which those running time-price totals and the facilitation look-ups are taken.
A time-price opportunity counts the prices printed inside a lettered half-hour bracket, and the running total of these prints is the raw input to the facilitation table. Tick count records how many minimum price increments the session has traversed so far and is used as a range-growth cross-check on the time-price count.
How the percentile ladders are built
The reference ladders were built from 210 Treasury-bond auction-report days from mid-October 1986 through 24 August 1987, a window chosen because it mixed advancing, declining, quiet, and active conditions.
Construction converts each day into a TPO line: a single day's series of running time-price totals at the close of each half-hour letter, from the opening bracket through the final bracket, lettered A through L. Those days are sorted on the final-period total, averaged in groups of 10 to produce 21 rows, and mapped onto a 0-100 percent scale in 5 percent steps. The mapped value is the trade-facilitation factor, a zero-to-one-hundred percentile that locates the current cumulative print or tick total against that compressed historical sample of like sessions.
Because the sort is anchored on the last period, earlier half-hour columns need not rise uniformly. A small group size of 10 days per average is given as the reason a middle column can show a local bump.
T-bond TPO facilitation ladder by half-hour bracket
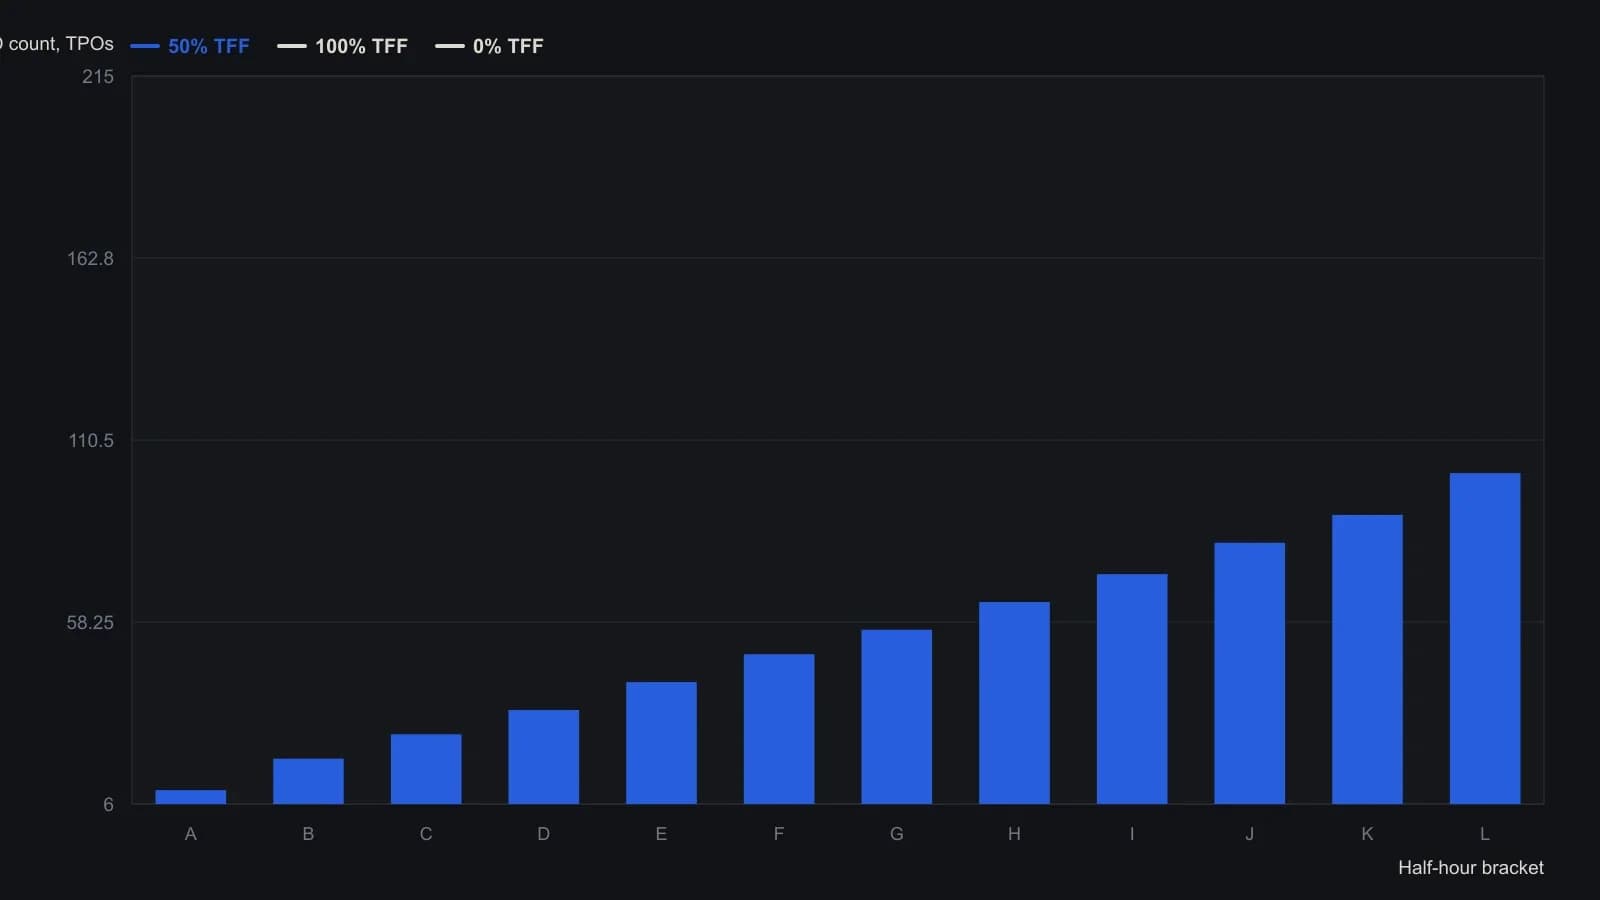
Ladders come from 210 T-bond Liquidity Data Bank days, mid-October 1986 through 24 August 1987, converted to cumulative TPO lines, sorted on the L-period total and averaged in groups of 10 days into 5-percentile steps. Earlier columns are not strictly monotonic because of those 10-day averages. The 0 percent L-period cell sits on the cropped right edge of the scan and is read as 53. Official volume is not in this live table.
Reading the print and tick tables
In the worked look-up, 86 time-price prints by period H sit next to a table value of 85 and read as an 85 percent facilitation score. The most active sample day reaches 215 prints, while the quietest row has 6 or fewer prints in A and 32 or fewer by G.
After-the-fact session snapshots span a near-zero reading on a quiet day with 34 prints and 8 ticks, mid-range 45 percent / 45 percent on a 99-print / 24-tick day, and very high readings on 185-print / 88-tick days.
The ratio ladder and split readings
The ratio ladder starts near 1.0 in period A. At the top of the sample it rises by somewhat less than a factor of three from A to L, while at the bottom it runs from 1 to 4.8, with the high ratios attributed to profiles that fatten when facilitation is low.
A split reading is treated as an alert rather than a single grade. One later snapshot showed 48 prints at period I for a 5 percent time-price score, about 55 percent on ticks, and a 2.1 print-to-tick ratio that mapped to 100 percent on the ratio table.
Volume as a fourth check after the close
Official volume is left out of the live tables because it was not available during the session. After the close it is specified as a fourth confirmation. Volume confirmation uses that official volume, once it exists, as a fourth cross-check that can accept or modify the three live facilitation readings.
Volume profile, the distribution of traded size across price, is treated here as an after-close check because live volume was not part of the daytime tables. The same arithmetic can be rebuilt for other futures once historical half-hour profiles exist.
All readings on this track · 20 readings
- 1987Intraday Value Area construction from TPO counts
- 1987Constructing session market profiles from half-hour auctions
- 1988Volume value area versus time-print filters
- 1988Auction control from a price, volume, and time ledger
- 1988Constructing intraday trade-facilitation percentile tables
- 1988Constructing session decisions from auction age and volume
- 1989Range extension after the opening auction
- 1989Constructing value maps from auction volume overlays
- 1989The bull hook as a next-session opening-range breakout filter
- 1990Incomplete volume-at-price samples and auction reads
- 1990Constructing overlay profiles to map auction value
- 1990Constructing daily overlay profiles for auction brackets and breaks
- 1990Volume-confirmed facilitation as an execution gate for half-hour breakouts
- 1992Volume-box construction with named spreadsheet macros
- 1993Commercial volume caps outside the value area
- 1993Hourly participant volume as a live filter for day trades
- 1999Assembling the daily auction from time-price opportunities
- 2000Who accepted price first in the auction
- 2002Treat the session as an auction: find value, then judge the breakout
- 2002Auction structure, trader constraints, and the opening range