2017issue C0858
Filter futures orders by liquidity, open interest, and volume
A listed-futures liquidity filter ranks how readily a position can be opened and closed. Open interest and volume confirmation then keep the rank from treating a large contract or a wide historical range as executable when the session is thin.
- A liquidity filter ranks listed markets by activity, outstanding size, and range-adjusted contract value rather than by a directional thesis.
- Open interest analysis treats outstanding contract count as a capacity multiplier, so a market with more open positions ranks as easier to enter and exit than an otherwise similar listing.
- Volume confirmation scales the rank by recent trading activity so a wide historical range or large contract value cannot produce a high rank when the session is thin.
- Relative contract liquidity and the other ranking columns are proportional comparisons only. Sparse activity marks correspond to little trading activity and a lower rank than dense marks.
What the pre-trade screen measures
A liquidity filter is a pre-trade screen that ranks listed markets by how readily a position can be opened and closed. It uses activity, outstanding size, and range-adjusted contract value rather than a directional thesis.
Open interest analysis reads outstanding contract count as a capacity multiplier so a market with more open positions ranks as easier to enter and exit than an otherwise similar listing. Volume confirmation then scales a liquidity rank by recent trading activity so a wide historical range or large contract value cannot produce a high rank when the session is thin.
How the liquidity rank is assembled
A futures liquidity rank can be assembled by multiplying contract point value, a three-year maximum price motion, open interest, and an activity factor usually between 1 and 4.
The same relative contract liquidity score can be written as the equal-dollar contract count times total open interest times a volume factor. Relative contract liquidity is a comparative score of how easily the full set of contracts in one futures market can be bought or sold versus other listed markets in the same table.
The equal-dollar contract count equals tick dollar value times the three-year maximum price excursion, so every entry in that column shares one dollar scale. It states how many contracts of one listing must be traded so that the three-year dollar price excursion matches that of another listing.
Volume confirmation
The volume factor is the greater of 1 and an exponential of the natural log of volume divided by the natural log of 5000, minus 2. Used as volume confirmation, that factor keeps a thin session from inheriting a high rank from contract size or historical range alone.
Margin, range, and the equity analogue
Effective percent margin equals margin dollars divided by the three-year dollar range of the contract, then multiplied by one hundred. It compares capital locked per unit of historical range.
For equities, period volume as a percentage of shares outstanding is presented as a turnover-rate proxy for trading liquidity. That share turnover figure is an equity proxy for how readily a security can be traded, not a substitute for the futures rank.
How to read the columns
Each liquidity column is a proportional comparison only. Sparse activity marks correspond to little trading activity and a lower rank than dense marks.
Contracts needed for equal dollar profit, August 2017 futures
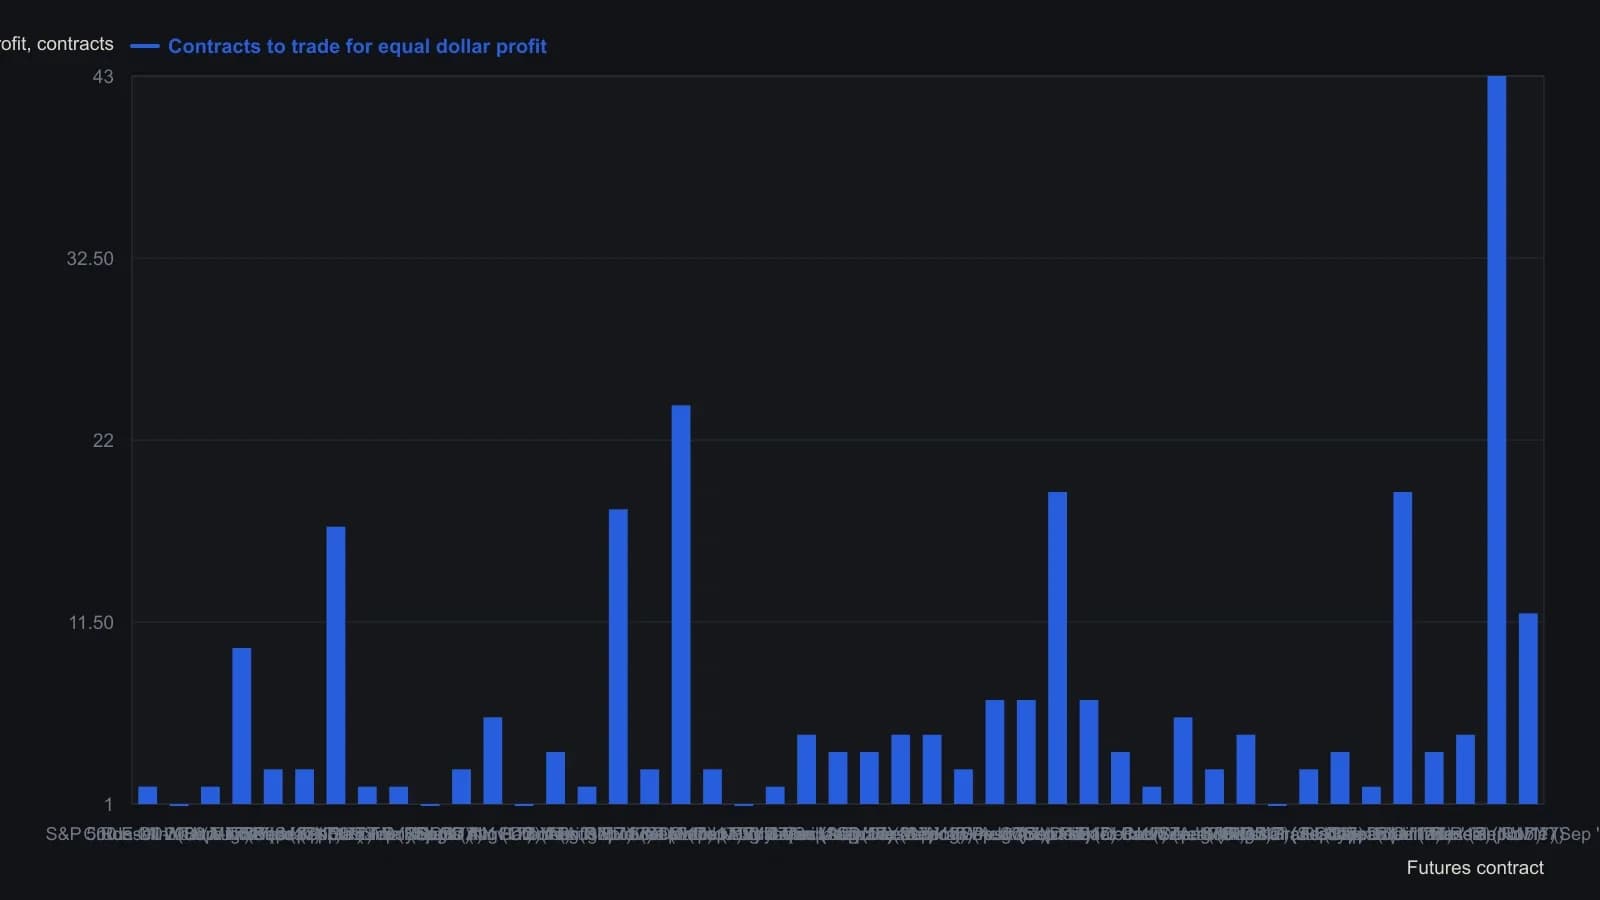
Contracts to Trade equals tick dollar value times the three-year maximum price excursion. Relative Contract Liquidity is shown in the source as a descending dot bar and is not a recoverable numeric series.
All readings on this track · 40 readings
- 1988Constructing volume-confirmation overlays on OHLC spreadsheet charts
- 1989Commodity advance-decline from delivery months
- 1989The most-active list as a three-layer breadth lab
- 1989Constructing a yield-curve volume-breadth composite
- 1989A bond-futures case study in support, volume, and confirmation
- 1989Volume-scaled price boxes and volume cycles
- 1990Futures-signed on-balance volume construction
- 1990Self-relative volume boxes for news-free breakouts
- 1990Broadening swings, demand tests, and volume filters
- 1991A same-session pressure test of breadth and volume share
- 1991Tick extremes that confirm double tops and bottoms
- 1991Constructing auction fuel from volume and open interest
- 1994Constructing On-balance volume with smoothing and timeframe confirmation
- 1996A volume-gated moving-average trend combination
- 1996Constructing four-state range-volume bars
- 1997Failed trade review of a descending-triangle breakdown
- 1997Construct a head-and-shoulders before the neckline break
- 2004Volume confirmation is not optional for a head-and-shoulders reversal
- 2007Constructing a three-factor volume-price confirmation filter
- 2007Constructing a three-condition moving-average entry with a volume filter
- 2008Breakout rules that wait for volume and liquidity
- 2011Screen futures liquidity with open interest and volume
- 2011Filter executable futures with liquidity and open interest
- 2012Rank listed futures by liquidity before a forecast chooses the name
- 2012Filter futures liquidity using open interest and volume
- 2013Pre-trade futures liquidity as an execution filter
- 2014A futures liquidity screen from range, open interest and volume
- 2014Evaluating futures contract liquidity before execution
- 2014Constructing defended price lines from volume clusters
- 2014Filter futures by equal-dollar size, open interest, and volume
- 2015Filter futures ideas by ranked contract liquidity
- 2017Screen listed futures for execution liquidity first
- 2017Filter futures orders by liquidity, open interest, and volume
- 2018Using open interest and volume to rank futures liquidity
- 2018Score listed futures as an execution menu before the setup
- 2019Filtering futures orders with liquidity, open interest and volume
- 2019Futures liquidity as an execution filter
- 2020A futures liquidity board as a pre-trade execution filter
- 2020Sequenced volume and golden-cross breakout rules
- 2020Use a listed-futures liquidity filter before execution