1989issue C081-7
A daily checklist that separates the screen from the entry
This archive case walks through a daily equity checklist that starts with market state, builds a watchlist from relative strength and volume, and withholds a purchase until a predefined support level is tested. Names already at highs are parked, and an extended advance can stop the session at no trade.
- Read index trend, breadth, volume, and the age of the advance before any single-name filter.
- Improving relative strength and a material volume change can place a name on a watchlist, but they do not authorize a purchase.
- A pullback to support taken from a prior range or breakout is the condition that turns a parked name into an entry hypothesis.
- A long, well-confirmed advance can be a reason to stand aside even when no breakdown is visible.
Three observables and a checklist
Daily equity analysis is framed as workable from three core observables: relative strength, associated volume, and absolute price change. Further overlays are treated as optional enhancements.
The decision habit combines technical and fundamental fields on the same daily chart rather than treating price structure as sufficient by itself.
A checklist process reads market state, filters names, and withholds execution until a stated condition is met. Entry, exit, and standing aside are one sequence.
Market-first review
The case opens with a market-state checklist: the industrial average at 2347, a 26-point advance on strong volume, no breakdown in the advance-decline line, a three-month rally, and hypothesized support near 2150.
That market read treats a long, well-confirmed advance as close to a short-term top and therefore as a reason not to buy immediately, even when no technical breakdown is visible.
DJIA daily path into the 8 February 1989 close
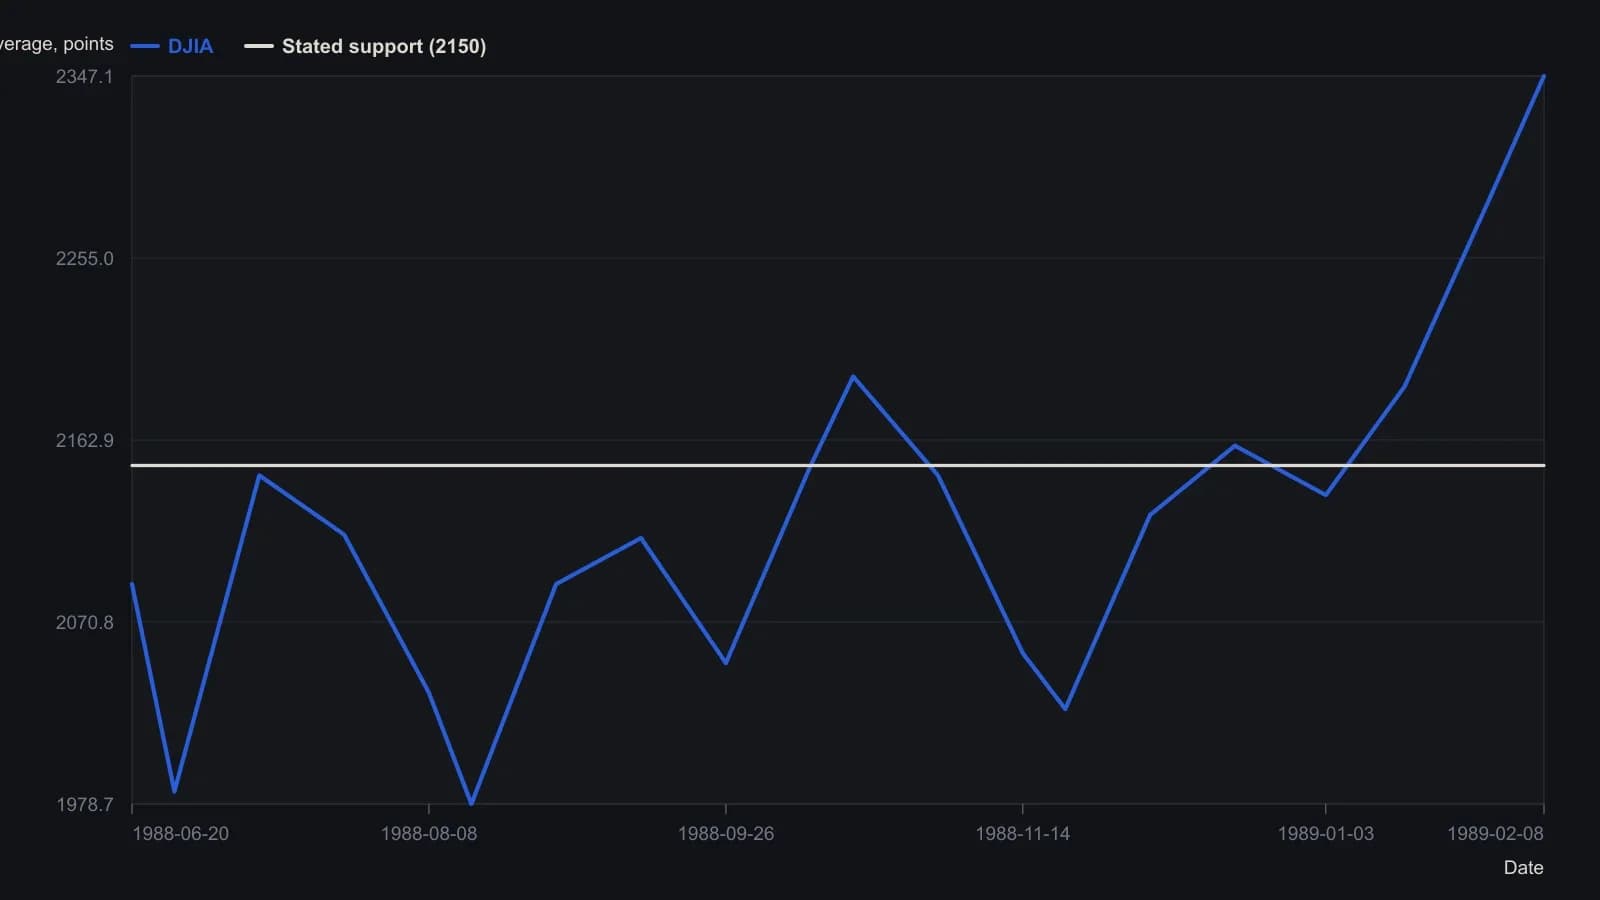
Unlabeled weekly readings are approximate to the newspaper raster and rounded to five points. Intraday wicks between sample dates are omitted.
Screening versus timing
Single-name screening is a staged filter: drop small-capitalization names of little institutional interest, keep those with improving relative strength, then keep those with dramatic volume change.
Relative strength is used as a ranking of how one equity is moving versus a comparison set over a defined lookback. It is a first-cut screen, not a standalone buy print. Volume confirmation requires a material change in activity before a price move counts as a candidate signal.
Names already showing strength or making new highs are parked as pullback candidates. The selection step is deliberately separated from the timing step.
Support as the entry condition
A later gate uses the fundamental fields on the daily chart unless a name is judged to be in play, in which case those fields may be set aside.
Support and resistance are taken from prior ranges, breakouts, and congestion and turned into falsifiable pullback-entry hypotheses.
After a six-month 60-70 range and an upside breakout, one name is assigned a pullback-entry hypothesis at new support near 70 rather than at the breakout print.
A second name is ranked on a sharper relative-strength upturn and group relative strength of 190, with planned entry at new support of 93-94 and prior resistance at 99-100.
A third name, treated as the session favorite, combined a sharp weekly relative-strength rise, volume not seen since the prior October, and a hypothesized pullback entry at support of 28-29.
All readings on this track · 12 readings
- 1989A daily checklist that separates the screen from the entry
- 2002Prior-week high and low as this week's support and resistance
- 2004A daily veto that left only a two-point afternoon short
- 2005A real-time audit after overriding a moving-average filter
- 2006Discretionary rules before leverage in forex
- 2008Flipped support and resistance as target zones
- 2011When expected chart setups fail, trade the pop
- 2012A mechanical rule set from the gold positioning reports
- 2014Volume-backed support and resistance construction
- 2015SMA-confirmed supply and demand breakouts as one mechanical procedure
- 2016Trade within your league as one decision process
- 2018Building a pre-trade checklist with stops and levels