1990issue C051-5
Buying-share scale with on-balance volume
A cumulative on-balance-volume line is treated as insufficient by itself to mark a bottom. The historical workflow reads it with a same-day buying-share percentage on a high-low-close chart, rescales that series to the window of lows, and uses a two-error regression-floor as a further oversold check.
- A cumulative on-balance-volume line is treated as insufficient by itself to mark a bottom and is read with a same-day buying-share percentage on a high-low-close chart.
- Buying-share is computed only from price as total-buying divided by the sum of total-buying and total-selling, then scaled by 100, with boundary readings of 100, 50, and 0.
- Normalized-buying-share occupies the span between the lowest and highest lows of the observation window, while a regression-floor two standard errors of estimate below a centered linear-regression fit is read as an oversold tag when price crosses it.
- Plot-window drops earlier non-relevant buying-share points after a trade is taken and stops plotting new values so the chart stays uncluttered.
The cumulative map is not enough at a low
A cumulative on-balance-volume line is treated as insufficient by itself to mark a bottom, so it is read together with a same-day buying-share percentage on a high-low-close chart.
On-balance-volume is a running accumulation of volume used here as a supply-and-demand map that can remain unclear at price lows if read alone.
L.A. Gear daily price, rescaled WADnl, and two-error regression floor, late 1989
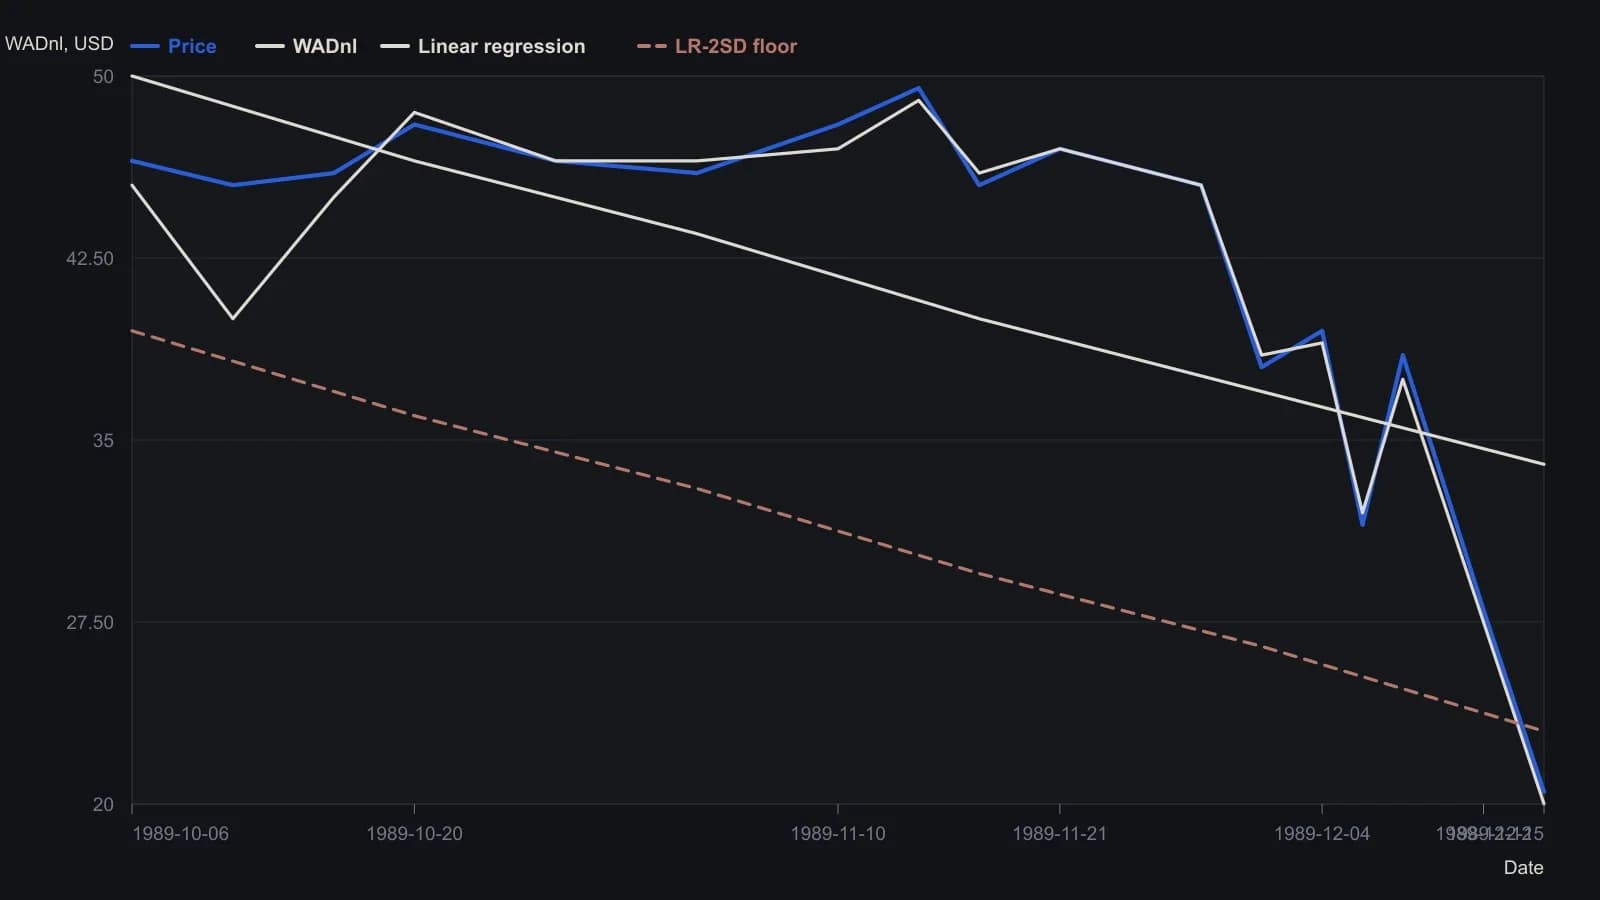
WADnl is drawn on the same vertical scale as price (rescaled to the window of lows). The two declining guides are a linear regression and a parallel floor two standard errors below it. Same-day buying share sits on a separate right-hand axis in the source and is omitted so this vertical scale stays in price units.
Buying-share from the day's range
Buying-share is a same-session estimate of how much of the day's range is treated as buying rather than selling. It is computed only from price, as total-buying divided by the sum of total-buying and total-selling, then scaled by 100.
Total-buying is the range-based buying component: one branch when the high sits above the prior close, and a shorter close-to-low branch when it does not. Total-selling is the complementary range-based selling component: one branch when the prior close sits above the low, and a shorter high-to-close branch when it does not. Both use high, low, close, and yesterday's close, with today's open allowed to replace yesterday's close when it is available.
Boundary readings of the buying-share percentage are defined as 100 when selling is zero, 50 when buying equals selling, and 0 when buying is zero.
Scale the series to the window of lows
The buying-share series is then linearly normalized so it occupies the span between the lowest and highest lows of the observation window. That rescaled series is the normalized-buying-share overlay on the same window of lows.
After a trade is taken, earlier non-relevant buying-share points are dropped and new values are no longer plotted. That plot-window practice keeps only the still-relevant buying-share points on the chart and stops the series once a trade is taken, to keep the chart uncluttered.
The auxiliary pane and the regression-floor
In one illustrated stock window, a rising normalized-buying-share series was presented as an early warning of a mid-September price reversal.
An auxiliary pane overlays approximate price and normalized on-balance-volume, the raw buying-share curve, and two parallel down-sloping lines. The upper line is a linear-regression fit through the center of the price data. The lower line is the regression-floor, drawn two standard errors of estimate below that fit. A price cross of that line is read as an oversold condition.
During a stretch of falling price on heavy volume, a buying-share curve that did not decline consistently was read as accumulation rather than persistent selling.
All readings on this track · 61 readings
- 1988Cumulative volume trend and 200-session polarity
- 1988Three clocks when cumulative volume led price
- 1988Payoff index checkpoints for open interest and divergence
- 1988Relative strength, stochastics, and on-balance volume as a turning-point stack
- 1988Signing volume by open interest change
- 1988Case study: weekly on-balance volume with trendlines and a 21-period average
- 1988Combining weekly and daily MACD divergences with on-balance volume
- 1988Restoring the original tests for market breadth, on-balance volume, and trendlines
- 1989Evaluating volume-weighted breadth extremes
- 1989Demand oscillator construction with a momentum overlay
- 1989Constructing a volume percentage ratio from advance-decline flow
- 1990Constructing net positive volume as On-balance volume
- 1990Buying-share scale with on-balance volume
- 1990Friday-filtered on-balance confirmation lines
- 1991Constructing rate-market volume breadth from on-balance volume
- 1991Building a breadth composite from on-balance volume breakouts
- 1992Constructing a rate-complex volume-breadth index
- 1992Constructing a breadth index from on-balance volume
- 1992Constructing signed market thrust from issue volume
- 1992Constructing indicator phase across averages, volume and bands
- 1993Force on-balance volume to agree with itself at slower horizons
- 1993Three transforms of market thrust from breadth and volume
- 1994Constructing a tick-line momentum oscillator
- 1994Constructing a smoothed on-balance tick momentum oscillator
- 1994Histogram confirmation and a second-series veto for MACD-family alerts
- 1994Constructing a 40-period envelope on on-balance volume
- 1996Constructing a matched percent-B volume disparity
- 1997Constructing calendar regime overlays and volume-weighted rules
- 1997Constructing market thrust from breadth and volume
- 1997Constructing on-balance volume as a signed running total
- 1997A three-layer construction for a signed volume-force oscillator
- 1997Constructing a range-sum volume-force oscillator
- 1999On-balance volume confirmation, price-indicator divergence, and bounded exits
- 2000A daily long-only confirmation stack on the tether line
- 2000A three-filter tether and volume trend system
- 2003Constructing finite volume elements as a finite-period money-flow filter
- 2003Constructing on-balance volume from signed session volume
- 2003On-balance volume as a market-breadth participation ledger
- 2003Construct a volatility-adjusted on-balance volume filter before confirming a breakout
- 2004Opening and midday ranges as an on-balance-volume breakout case
- 2004Constructing a volatility-gated volume-flow measure
- 2004Constructing a volume-flow series from on-balance volume
- 2004Volume-flow indicator construction from on-balance volume
- 2004Volume-flow slope divergence, then separate on-balance-volume and crossover rules
- 2004Volume flow and band construction as one inspectable problem
- 2004Auditing advance-decline confirmation for scale, horizon, and composition
- 2005Bounded market breadth from the Arms index to BRIN
- 2006Overnight-hold entry and exit construction
- 2007Evaluating Volume-price confirmation versus On-balance volume and MACD
- 2009Volume confirmation versus a price advance
- 2010Typeahead retrieval of a moving average, on-balance volume, and a stochastic oscillator
- 2010Modified volume-price trend and log-price scale alignment
- 2010Constructing liquidity accelerometers from advance-decline averages
- 2012Failed short cycles as breadth and volume tests
- 2016Earnings straddles, implied volatility, and money-flow filters
- 2017A volume residual filter and a price projection matrix
- 2019Volume-volatility parabola and signed-volume momentum
- 2019Separating on-balance volume into breadth and volume
- 2020Constructing the obvm signal line
- 2020Constructing smoothed on-balance volume with a signal line
- 2020Keep neutrality as a first-class input in three-state market data