2016issue C0130-31
Earnings straddles, implied volatility, and money-flow filters
A long at-the-money straddle can already embed a large post-report move. This archive article walks through that premium check, then the moving-average, volume-flow, and trend-following filters used to ask whether a directional break is even plausible.
- A long at-the-money straddle is a same-strike, same-expiry call and put whose combined premium is larger than one directional side and can already price the post-report jump.
- The illustrated week-expiry 570 package cost about 50 points, implying an 8.5 percent move, with only one session left after the report, and was rejected because that left too little time to outrun the priced range.
- Straddles were treated as useful only when volatility is low and a break or a volatility rise is expected.
- A preferred 20, 50, and 200 moving-average stack, a 20-period money-flow oscillator, and a color-coded trend-following state map were then used to judge whether a directional break was even plausible.
A two-layer reading of a crowded event
Editorial: TradersWeek treats a crowded event trade as a two-layer filter. First ask whether implied volatility already prices the expected jump. Then ask whether volume-flow and trend-state tools agree that a directional break is even plausible.
A long at-the-money straddle is a same-strike, same-expiry call-plus-put package. Its combined premium is larger than taking one directional side.
The premium can already price the move
Near-term implied volatility on the illustrated name moved inside a 20 to 80 range. In the archive treatment, a swing from the low end of that band to the high end multiplies option time value by a factor of four.
The illustrated week-expiry 570 call and 570 put together cost about 50 points. That package implied an 8.5 percent post-report move already priced into the straddle.
With only one session after the report before that expiry, a profitable close required a move larger than the already-priced 50-point range. That one-day-after-earnings straddle was rejected because the package cost 5000 per contract and left too little time for the move to exceed the priced range.
AMZN weekly 570 call, put, and straddle premiums
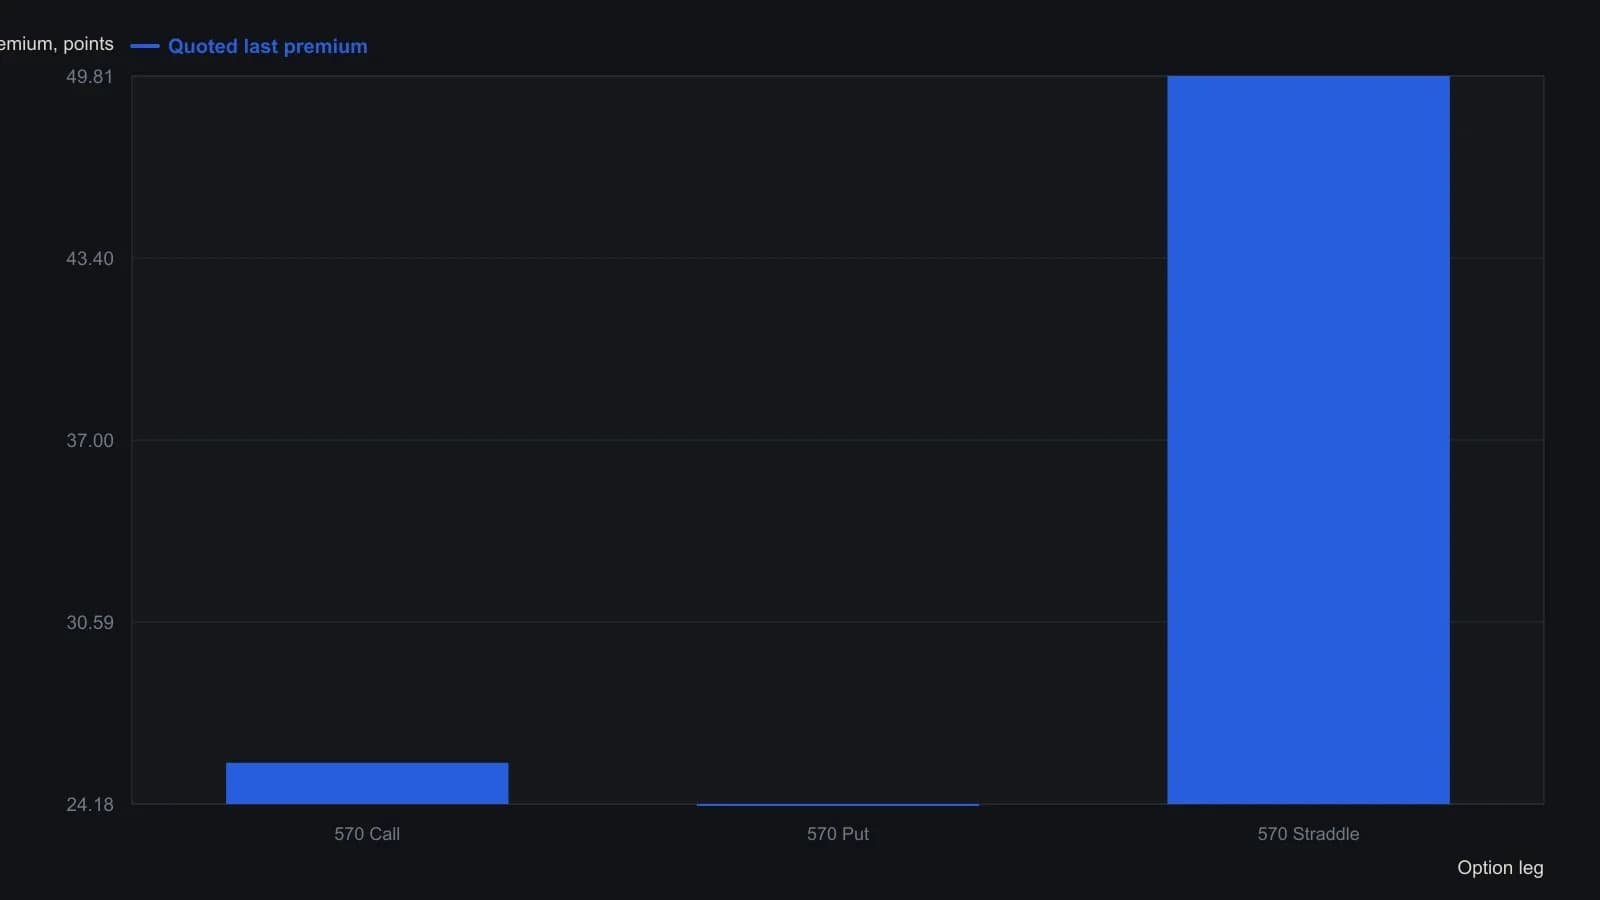
Weekly 570 options expiring the session after the 22 October 2015 earnings print. Gentile rounded the combined last to about 50 points, or $5,000 per contract.
When a straddle was considered useful
Straddles are framed as useful only when volatility is low and a break or a volatility rise is expected. Other motives do not stack conditions in the trader's favor.
Editorial: TradersWeek reads that framing as the first filter. If implied volatility is already elevated, the archive workflow does not treat the event itself as a reason to own the package.
A moving-average baseline for trend state
The moving-average method is a smoothed average of recent prices used as a baseline for slope, stack order, and whether a shorter window has crossed a longer one.
A preferred moving-average stack is the 20-period simple average above the 50, and the 50 above the 200. When the 50 flattens, the 20 has usually already crossed beneath it.
A more aggressive moving-average rule can start a position when both the 20 and the 50 have turned in the same direction even if they have not yet crossed the 200.
Volume flow and a trend-following state map
On-balance volume is a volume-accumulation reading that confirms or contradicts a price trend by tracking whether volume is flowing with or against the move. Editorial: TradersWeek treats the archive money-flow oscillator as that kind of volume-flow reading.
The money-flow oscillator is coded as a 20-period sum of signed volume share of range, with a zero-volume and zero-range guard. A 50-day smooth is proposed as a medium-horizon trend filter.
Trend-following is a rules-based procedure that classifies market state as up, down, or extreme and only acts when that state remains consistent.
In the illustrated index example, downtrends were treated as ending only when the volume-flow readings were clearly violated. The oscillator was checked against a color-coded trend-following state map.
All readings on this track · 61 readings
- 1988Cumulative volume trend and 200-session polarity
- 1988Three clocks when cumulative volume led price
- 1988Payoff index checkpoints for open interest and divergence
- 1988Relative strength, stochastics, and on-balance volume as a turning-point stack
- 1988Signing volume by open interest change
- 1988Case study: weekly on-balance volume with trendlines and a 21-period average
- 1988Combining weekly and daily MACD divergences with on-balance volume
- 1988Restoring the original tests for market breadth, on-balance volume, and trendlines
- 1989Evaluating volume-weighted breadth extremes
- 1989Demand oscillator construction with a momentum overlay
- 1989Constructing a volume percentage ratio from advance-decline flow
- 1990Constructing net positive volume as On-balance volume
- 1990Buying-share scale with on-balance volume
- 1990Friday-filtered on-balance confirmation lines
- 1991Constructing rate-market volume breadth from on-balance volume
- 1991Building a breadth composite from on-balance volume breakouts
- 1992Constructing a rate-complex volume-breadth index
- 1992Constructing a breadth index from on-balance volume
- 1992Constructing signed market thrust from issue volume
- 1992Constructing indicator phase across averages, volume and bands
- 1993Force on-balance volume to agree with itself at slower horizons
- 1993Three transforms of market thrust from breadth and volume
- 1994Constructing a tick-line momentum oscillator
- 1994Constructing a smoothed on-balance tick momentum oscillator
- 1994Histogram confirmation and a second-series veto for MACD-family alerts
- 1994Constructing a 40-period envelope on on-balance volume
- 1996Constructing a matched percent-B volume disparity
- 1997Constructing calendar regime overlays and volume-weighted rules
- 1997Constructing market thrust from breadth and volume
- 1997Constructing on-balance volume as a signed running total
- 1997A three-layer construction for a signed volume-force oscillator
- 1997Constructing a range-sum volume-force oscillator
- 1999On-balance volume confirmation, price-indicator divergence, and bounded exits
- 2000A daily long-only confirmation stack on the tether line
- 2000A three-filter tether and volume trend system
- 2003Constructing finite volume elements as a finite-period money-flow filter
- 2003Constructing on-balance volume from signed session volume
- 2003On-balance volume as a market-breadth participation ledger
- 2003Construct a volatility-adjusted on-balance volume filter before confirming a breakout
- 2004Opening and midday ranges as an on-balance-volume breakout case
- 2004Constructing a volatility-gated volume-flow measure
- 2004Constructing a volume-flow series from on-balance volume
- 2004Volume-flow indicator construction from on-balance volume
- 2004Volume-flow slope divergence, then separate on-balance-volume and crossover rules
- 2004Volume flow and band construction as one inspectable problem
- 2004Auditing advance-decline confirmation for scale, horizon, and composition
- 2005Bounded market breadth from the Arms index to BRIN
- 2006Overnight-hold entry and exit construction
- 2007Evaluating Volume-price confirmation versus On-balance volume and MACD
- 2009Volume confirmation versus a price advance
- 2010Typeahead retrieval of a moving average, on-balance volume, and a stochastic oscillator
- 2010Modified volume-price trend and log-price scale alignment
- 2010Constructing liquidity accelerometers from advance-decline averages
- 2012Failed short cycles as breadth and volume tests
- 2016Earnings straddles, implied volatility, and money-flow filters
- 2017A volume residual filter and a price projection matrix
- 2019Volume-volatility parabola and signed-volume momentum
- 2019Separating on-balance volume into breadth and volume
- 2020Constructing the obvm signal line
- 2020Constructing smoothed on-balance volume with a signal line
- 2020Keep neutrality as a first-class input in three-state market data