2010issue C0756-62
Constructing liquidity accelerometers from advance-decline averages
A 1969 construction differences a faster and a slower exponential average of advance-decline data, then sums that breadth oscillator so a plus-500 failure can reject a durable-uptrend start. Non-operating listings and signed volume flow stay inside the gauge.
- Subtracting a 39-day exponential average of advance-decline data from a 19-day exponential average measures acceleration in market breadth.
- The advance-decline line is not expected to rise unless the liquidity stream is broad enough to lift the whole list, even when major averages rise on a few names.
- If the ratio-adjusted summation does not climb through plus 500, the reading is a plus-500 failure and is not taken as the start of a durable uptrend.
- Non-operating listings and on-balance volume stay in the gauge as liquidity and flow checks instead of being filtered out.
Breadth as a liquidity reading
The archive describes a 1969 construction that starts from market breadth, the daily mix of advancing versus declining issues, and treats that mix as a liquidity reading rather than a single-stock pattern.
A moving average here is a lookback smoother of ordered breadth, price, or volume observations. Two exponential averages of different speeds are differenced to form a breadth oscillator. That oscillator is then summed so a named rebuild test can fail a durable-uptrend hypothesis.
A two-speed difference of advance-decline data
The construction subtracts a slower exponential average of advance-decline data from a faster one in order to measure acceleration in market breadth. The slower average is the 5 percent trend, later identified as a 39-day exponential moving average. The faster average is the 10 percent trend, later identified as a 19-day exponential moving average.
The resulting gap is the breadth oscillator. It is read as acceleration or deceleration in breadth.
When the advance-decline line is allowed to rise
Under that construction, major averages can rise on a thin cash stream if money is concentrated in a few names. The advance-decline line, a cumulative total of daily advances minus declines, is not expected to rise unless liquidity is broad enough to lift the whole list.
The liquidity stream is the cash available to lift many issues at once. Thin liquidity can still raise a few large names without lifting the advance-decline line.
Non-operating listings stay in the tally
A contemporaneous exchange count in the source put about 3,200 listed issues against only about 1,800 operating companies. Preferred shares, rights, warrants, closed-end funds, and bond funds therefore enter the raw breadth tally.
The archive does not treat those non-operating issues as items to filter out. It reports that closed-end bond-fund advance-decline peaked in May 2007, ahead of the October 2007 peak in the broader market averages, and reads that earlier turn as a liquidity warning.
Editorial: TradersWeek treats those non-operating listings as part of the gauge rather than as contaminants to remove.
Integrating the oscillator into a running sum
Summing successive breadth-oscillator readings produces a summation index, a running total that climbs when the oscillator is strongly positive, goes sideways when the oscillator hovers near zero, and declines when the oscillator is strongly negative.
A ratio-adjusted summation rescales the sample as if exactly 1,000 issues trade each day, so listing growth or shrinkage does not distort the level. A failure of that series to climb through plus 500 is labeled a plus-500 failure. It is read as an inability to start a durable uptrend.
Ratio-adjusted summation index versus the +500 launch line
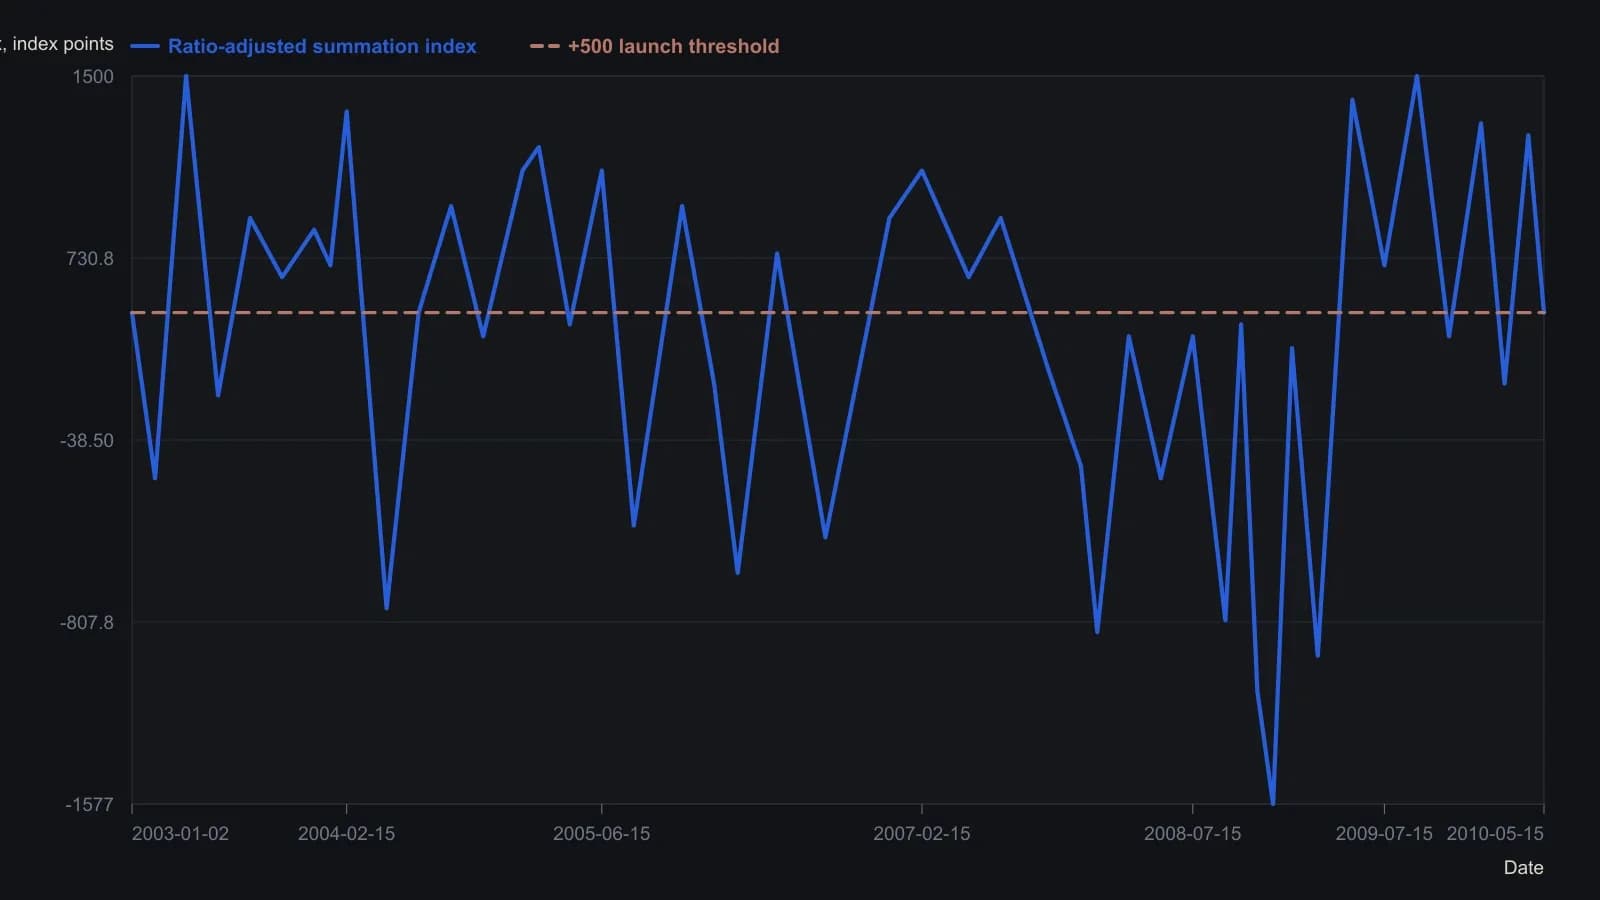
The published series is ratio-adjusted so the tape is treated as if exactly 1,000 issues always trade, keeping the +500 test comparable as the NYSE roster changes. Digitized from a small raster, so turning points are approximate to about ±50 index points.
Path shape as extra information
Oscillator path shape is treated as extra information beyond sign, extreme, and divergence. A choppy structure that stays above zero is read as upside strength. A simple dip just below zero is read as weakness on the downside.
The same difference on tick breadth
Official advance-decline prints are typically daily. The same two-speed moving-average difference can be applied intraday to the tick series using a 19-bar and a 39-bar exponential average.
Tick breadth is the intraday count of stocks whose last print was an uptick minus those whose last print was a downtick. It is used when official advance-decline prints are only daily.
Signed volume as the flow check
Signed volume accumulation, the same running-flow idea as on-balance volume, is the volume-side check on a breadth reading. On-balance volume adds volume on up periods and subtracts it on down periods, and it is used here as the volume-flow counterpart to a running breadth sum.
Stock tops are described as quiet, low-volume events. A pattern is not treated as confirmed without volume agreement.
Size follows coincident confirmation
In the archive workflow, position size is increased only when a prior cycle or seasonal expectation is confirmed by coincident checks such as weakening liquidity, momentum divergence, a broken uptrend line, or a price cross of a moving average.
Conflicting indicators reduce depth rather than being forced into agreement. The moving average can therefore serve as a trend-break exit line as well as one half of the breadth oscillator.
All readings on this track · 61 readings
- 1988Cumulative volume trend and 200-session polarity
- 1988Three clocks when cumulative volume led price
- 1988Payoff index checkpoints for open interest and divergence
- 1988Relative strength, stochastics, and on-balance volume as a turning-point stack
- 1988Signing volume by open interest change
- 1988Case study: weekly on-balance volume with trendlines and a 21-period average
- 1988Combining weekly and daily MACD divergences with on-balance volume
- 1988Restoring the original tests for market breadth, on-balance volume, and trendlines
- 1989Evaluating volume-weighted breadth extremes
- 1989Demand oscillator construction with a momentum overlay
- 1989Constructing a volume percentage ratio from advance-decline flow
- 1990Constructing net positive volume as On-balance volume
- 1990Buying-share scale with on-balance volume
- 1990Friday-filtered on-balance confirmation lines
- 1991Constructing rate-market volume breadth from on-balance volume
- 1991Building a breadth composite from on-balance volume breakouts
- 1992Constructing a rate-complex volume-breadth index
- 1992Constructing a breadth index from on-balance volume
- 1992Constructing signed market thrust from issue volume
- 1992Constructing indicator phase across averages, volume and bands
- 1993Force on-balance volume to agree with itself at slower horizons
- 1993Three transforms of market thrust from breadth and volume
- 1994Constructing a tick-line momentum oscillator
- 1994Constructing a smoothed on-balance tick momentum oscillator
- 1994Histogram confirmation and a second-series veto for MACD-family alerts
- 1994Constructing a 40-period envelope on on-balance volume
- 1996Constructing a matched percent-B volume disparity
- 1997Constructing calendar regime overlays and volume-weighted rules
- 1997Constructing market thrust from breadth and volume
- 1997Constructing on-balance volume as a signed running total
- 1997A three-layer construction for a signed volume-force oscillator
- 1997Constructing a range-sum volume-force oscillator
- 1999On-balance volume confirmation, price-indicator divergence, and bounded exits
- 2000A daily long-only confirmation stack on the tether line
- 2000A three-filter tether and volume trend system
- 2003Constructing finite volume elements as a finite-period money-flow filter
- 2003Constructing on-balance volume from signed session volume
- 2003On-balance volume as a market-breadth participation ledger
- 2003Construct a volatility-adjusted on-balance volume filter before confirming a breakout
- 2004Opening and midday ranges as an on-balance-volume breakout case
- 2004Constructing a volatility-gated volume-flow measure
- 2004Constructing a volume-flow series from on-balance volume
- 2004Volume-flow indicator construction from on-balance volume
- 2004Volume-flow slope divergence, then separate on-balance-volume and crossover rules
- 2004Volume flow and band construction as one inspectable problem
- 2004Auditing advance-decline confirmation for scale, horizon, and composition
- 2005Bounded market breadth from the Arms index to BRIN
- 2006Overnight-hold entry and exit construction
- 2007Evaluating Volume-price confirmation versus On-balance volume and MACD
- 2009Volume confirmation versus a price advance
- 2010Typeahead retrieval of a moving average, on-balance volume, and a stochastic oscillator
- 2010Modified volume-price trend and log-price scale alignment
- 2010Constructing liquidity accelerometers from advance-decline averages
- 2012Failed short cycles as breadth and volume tests
- 2016Earnings straddles, implied volatility, and money-flow filters
- 2017A volume residual filter and a price projection matrix
- 2019Volume-volatility parabola and signed-volume momentum
- 2019Separating on-balance volume into breadth and volume
- 2020Constructing the obvm signal line
- 2020Constructing smoothed on-balance volume with a signal line
- 2020Keep neutrality as a first-class input in three-state market data