1988issue C041-5
Signing volume by open interest change
A price-signed volume cumulative adds session volume on advancing days and subtracts it on declining days. An alternative signs the same volume by whether open interest is higher or lower than it was a chosen number of sessions earlier, then reads confirmation and divergence against price.
- A price-signed volume cumulative is a running sum that adds volume on advancing days and subtracts it on declining days. It is used to separate trending from non-trending markets and to flag possible reversals when the line diverges from the price trend.
- The alternative cumulative is built from volume and open interest alone. Session volume is added when open interest is above its value a chosen number of sessions earlier, subtracted when open interest is lower, and the running total is that day’s reading.
- Confirmation and divergence are read the same way as on a price-signed study: in-step trends, an unconfirmed price spike, a selloff the cumulative leads, and a new high in the cumulative that price does not match.
- When the signing rule makes the line rise as prices fall, the plot is inverted for visual comparison. Large seasonal swings in open interest are said to weaken the construction unless those figures are adjusted first.
Two jobs of a price-signed volume cumulative
A price-signed volume cumulative is described as a running sum of volume that is added on advancing days and subtracted on declining days.
That conventional series is given two jobs: filtering trending from non-trending markets, and flagging possible reversals when it diverges from the price trend.
Sign volume with open interest, not the close
An alternative cumulative is defined from volume and open interest alone, on the premise that a vertical price bar is a function of participant activity measured by those two series.
Construction adds the day’s volume when open interest exceeds its value a chosen number of sessions earlier, subtracts the day’s volume when open interest is lower, and takes the running total as that day’s reading.
The open-interest comparison window is treated as an adjustable parameter. A four-session setting is used in the illustrations, and other lengths are treated as open experiments.
Keep the same confirmation and divergence habits
Worked overlays are used to show in-step trends, an abrupt price spike the cumulative does not follow, a selloff the cumulative leads, and a case where the cumulative makes a new high while price does not.
A later unconfirmed advance after a confirmed decline is read as a bearish non-confirmation. A rising cumulative against a still-falling price is given four competing readings: noise, a shift out of trend, accumulation, or reversal.
Further overlays are presented as showing buildup of positions near lows and reduction near highs, often before the price turn.
Invert the plot in a declining market
Because the same rules make the cumulative rise during price declines in a falling market, the chart is inverted so the line can still be compared visually with price.
Adjust seasonal open interest before signing volume
Large seasonal swings in open interest are said to weaken the construction unless those figures are adjusted first. Currency and financial contracts are named as cleaner applications.
Reading is described as a visual treatment of open interest and volume analogous to a price-signed volume line.
COMEX December 1983 gold, daily
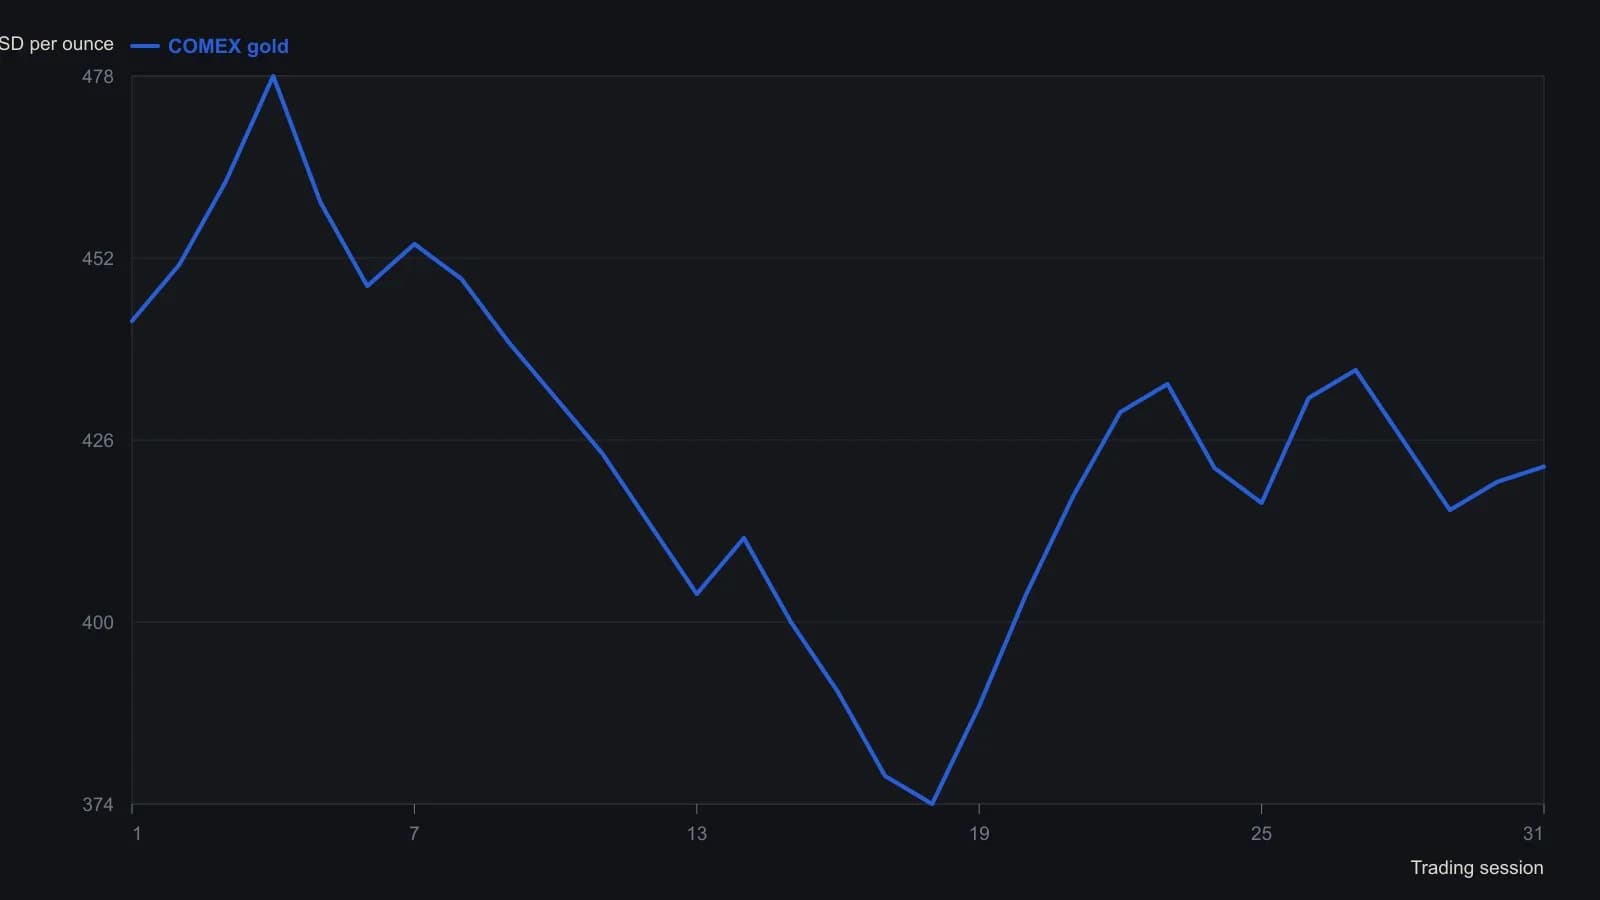
The source also draws a smoother OAH overlay on this same price axis. That overlay is omitted because it is not dimensioned in cumulative volume; only gold can be recovered in native units. Purifoy signs volume with an open-interest lookback of c=4.
All readings on this track · 61 readings
- 1988Cumulative volume trend and 200-session polarity
- 1988Three clocks when cumulative volume led price
- 1988Payoff index checkpoints for open interest and divergence
- 1988Relative strength, stochastics, and on-balance volume as a turning-point stack
- 1988Signing volume by open interest change
- 1988Case study: weekly on-balance volume with trendlines and a 21-period average
- 1988Combining weekly and daily MACD divergences with on-balance volume
- 1988Restoring the original tests for market breadth, on-balance volume, and trendlines
- 1989Evaluating volume-weighted breadth extremes
- 1989Demand oscillator construction with a momentum overlay
- 1989Constructing a volume percentage ratio from advance-decline flow
- 1990Constructing net positive volume as On-balance volume
- 1990Buying-share scale with on-balance volume
- 1990Friday-filtered on-balance confirmation lines
- 1991Constructing rate-market volume breadth from on-balance volume
- 1991Building a breadth composite from on-balance volume breakouts
- 1992Constructing a rate-complex volume-breadth index
- 1992Constructing a breadth index from on-balance volume
- 1992Constructing signed market thrust from issue volume
- 1992Constructing indicator phase across averages, volume and bands
- 1993Force on-balance volume to agree with itself at slower horizons
- 1993Three transforms of market thrust from breadth and volume
- 1994Constructing a tick-line momentum oscillator
- 1994Constructing a smoothed on-balance tick momentum oscillator
- 1994Histogram confirmation and a second-series veto for MACD-family alerts
- 1994Constructing a 40-period envelope on on-balance volume
- 1996Constructing a matched percent-B volume disparity
- 1997Constructing calendar regime overlays and volume-weighted rules
- 1997Constructing market thrust from breadth and volume
- 1997Constructing on-balance volume as a signed running total
- 1997A three-layer construction for a signed volume-force oscillator
- 1997Constructing a range-sum volume-force oscillator
- 1999On-balance volume confirmation, price-indicator divergence, and bounded exits
- 2000A daily long-only confirmation stack on the tether line
- 2000A three-filter tether and volume trend system
- 2003Constructing finite volume elements as a finite-period money-flow filter
- 2003Constructing on-balance volume from signed session volume
- 2003On-balance volume as a market-breadth participation ledger
- 2003Construct a volatility-adjusted on-balance volume filter before confirming a breakout
- 2004Opening and midday ranges as an on-balance-volume breakout case
- 2004Constructing a volatility-gated volume-flow measure
- 2004Constructing a volume-flow series from on-balance volume
- 2004Volume-flow indicator construction from on-balance volume
- 2004Volume-flow slope divergence, then separate on-balance-volume and crossover rules
- 2004Volume flow and band construction as one inspectable problem
- 2004Auditing advance-decline confirmation for scale, horizon, and composition
- 2005Bounded market breadth from the Arms index to BRIN
- 2006Overnight-hold entry and exit construction
- 2007Evaluating Volume-price confirmation versus On-balance volume and MACD
- 2009Volume confirmation versus a price advance
- 2010Typeahead retrieval of a moving average, on-balance volume, and a stochastic oscillator
- 2010Modified volume-price trend and log-price scale alignment
- 2010Constructing liquidity accelerometers from advance-decline averages
- 2012Failed short cycles as breadth and volume tests
- 2016Earnings straddles, implied volatility, and money-flow filters
- 2017A volume residual filter and a price projection matrix
- 2019Volume-volatility parabola and signed-volume momentum
- 2019Separating on-balance volume into breadth and volume
- 2020Constructing the obvm signal line
- 2020Constructing smoothed on-balance volume with a signal line
- 2020Keep neutrality as a first-class input in three-state market data