1997issue C121-5
Constructing a range-sum volume-force oscillator
This archive article rebuilds a volume-price oscillator as three separable layers: a high-low-close trend label, a range-normalized volume force, and a 34-versus-55 exponential spread with a 13-period trigger that can mark exhaustion and divergence left unlabeled by close-only on-balance volume.
- Trend assignment comes from the high-plus-low-plus-close sum, so a down close can still be accumulation and an up close can still be distribution.
- Volume force scales daily volume by how much of the current trend’s accumulated range sits in today’s bar, then signs the result by that trend.
- The oscillator is the 34-period exponential average of volume force minus the 55-period average, with a 13-period trigger used to mark turns before a centerline cross.
- Alerts that agree with the prevailing price trend rank above countertrend alerts, which are described as needing further basing and a later trend change.
The gap close-only volume totals leave unmarked
Close-based on-balance volume models are treated as useful converters of raw volume that still leave many short-term highs and lows unmarked. That unlabeled stretch of short-term extremes is the gap this construction targets.
Volume-price analysis here means reading accumulation and distribution from the high-low-close sum and the high-low range, then converting signed volume into a series that can confirm or challenge the price move.
Label trend from the high-low-close sum
Trend assignment is a plus-one accumulation or minus-one distribution label from comparing today’s high-plus-low-plus-close total with yesterday’s. A rise versus the prior sum marks accumulation. A fall marks distribution. A tie keeps the prior label.
A security can be in accumulation on a down close or in distribution on an up close. This volume-price construction therefore refuses to define flow from the close alone.
Turn the sign into range-normalized volume force
Daily measurement is the session high minus the session low, used as the raw range input to the force calculation. Cumulative measurement is the running total of those daily ranges while the trend sign is unchanged. The total restarts when the sign flips.
Volume force multiplies daily volume by the absolute value of twice the daily-to-cumulative range ratio minus one, then by the trend sign and by 100. Daily volume is thereby scaled by how much of the current trend’s accumulated range is concentrated in today’s bar, then signed by the trend.
The 34-versus-55 spread and the trigger line
The oscillator is the 34-period exponential average of volume force minus the 55-period exponential average. A 13-period exponential average of that difference is the trigger line, used to mark turns before a centerline cross.
Exhaustion, divergence, and alert rank
A centerline extreme is an oscillator reading far above or below zero that then reverses. That turn is treated as exhaustion of the current volume-supported move.
Divergence is a new cycle high or low in price that the volume-force oscillator does not confirm, or any extreme where price and the oscillator move out of step.
The stated ranking places oscillator alerts that agree with the prevailing price trend above countertrend alerts. Countertrend alerts are described as requiring further basing and a later trend change.
Klinger volume oscillator on IOMEGA, 1996–1997
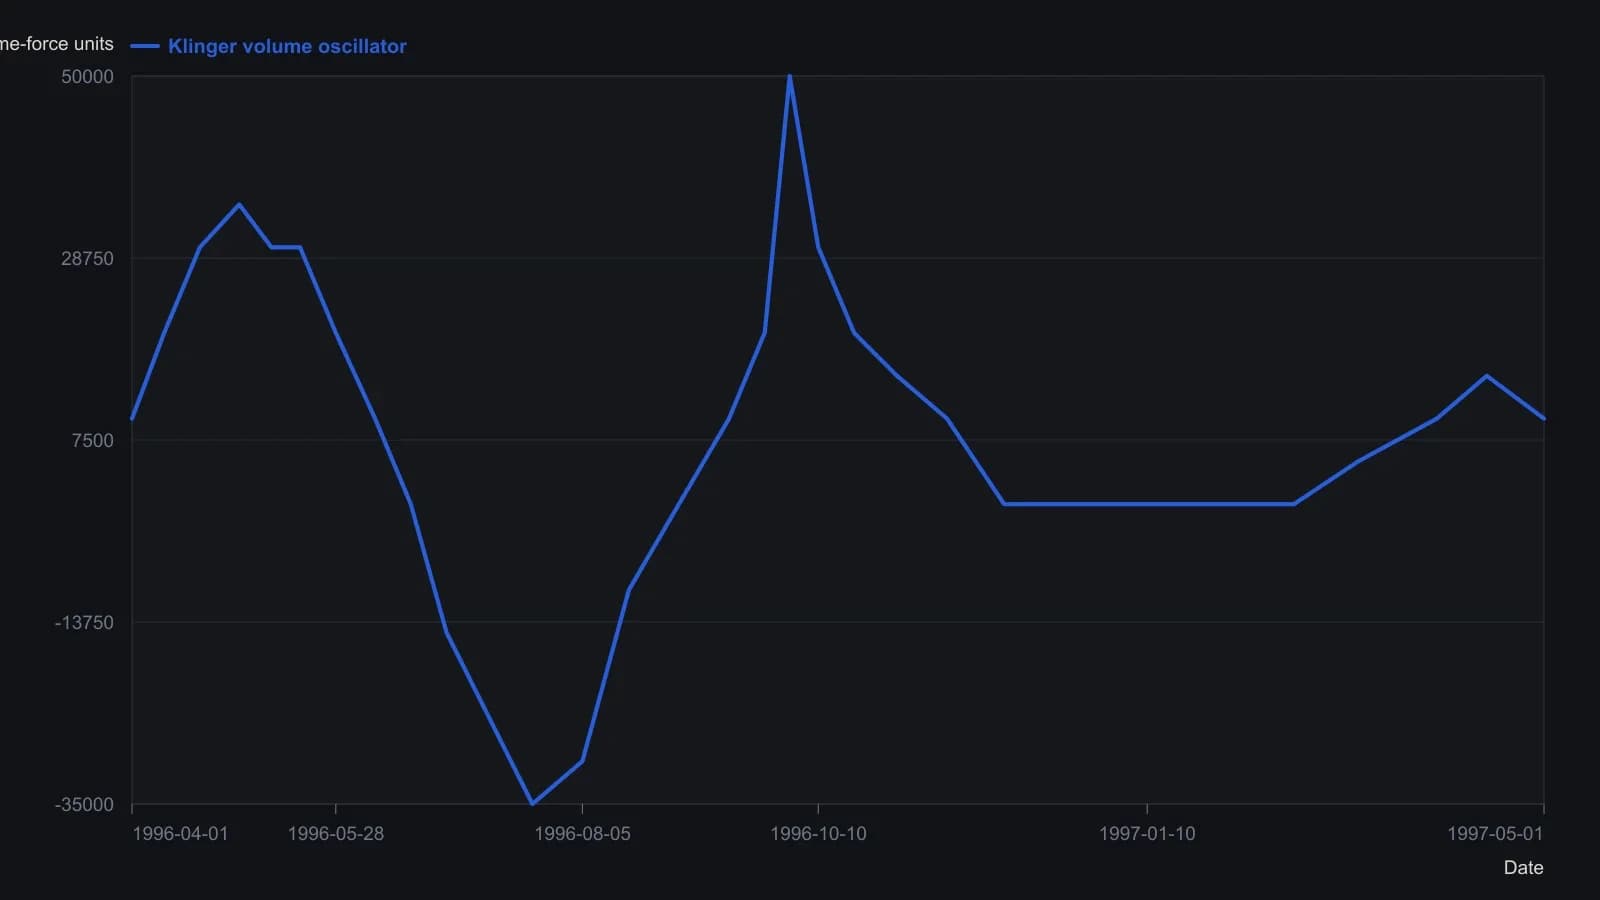
Digitized from the printed IOMEGA daily chart. The source builds this series as a 34-versus-55 exponential spread of range-normalized volume force, with a 13-period trigger drawn but not separately recovered here. Arrow marks on this figure sit on the May 1996 peaks.
A smoother longer-horizon recast
A cumulative recast of the same oscillator is a running total of that oscillator. It is described as smoother, with fewer crosses, and aimed at a longer money-flow horizon.
All readings on this track · 61 readings
- 1988Cumulative volume trend and 200-session polarity
- 1988Three clocks when cumulative volume led price
- 1988Payoff index checkpoints for open interest and divergence
- 1988Relative strength, stochastics, and on-balance volume as a turning-point stack
- 1988Signing volume by open interest change
- 1988Case study: weekly on-balance volume with trendlines and a 21-period average
- 1988Combining weekly and daily MACD divergences with on-balance volume
- 1988Restoring the original tests for market breadth, on-balance volume, and trendlines
- 1989Evaluating volume-weighted breadth extremes
- 1989Demand oscillator construction with a momentum overlay
- 1989Constructing a volume percentage ratio from advance-decline flow
- 1990Constructing net positive volume as On-balance volume
- 1990Buying-share scale with on-balance volume
- 1990Friday-filtered on-balance confirmation lines
- 1991Constructing rate-market volume breadth from on-balance volume
- 1991Building a breadth composite from on-balance volume breakouts
- 1992Constructing a rate-complex volume-breadth index
- 1992Constructing a breadth index from on-balance volume
- 1992Constructing signed market thrust from issue volume
- 1992Constructing indicator phase across averages, volume and bands
- 1993Force on-balance volume to agree with itself at slower horizons
- 1993Three transforms of market thrust from breadth and volume
- 1994Constructing a tick-line momentum oscillator
- 1994Constructing a smoothed on-balance tick momentum oscillator
- 1994Histogram confirmation and a second-series veto for MACD-family alerts
- 1994Constructing a 40-period envelope on on-balance volume
- 1996Constructing a matched percent-B volume disparity
- 1997Constructing calendar regime overlays and volume-weighted rules
- 1997Constructing market thrust from breadth and volume
- 1997Constructing on-balance volume as a signed running total
- 1997A three-layer construction for a signed volume-force oscillator
- 1997Constructing a range-sum volume-force oscillator
- 1999On-balance volume confirmation, price-indicator divergence, and bounded exits
- 2000A daily long-only confirmation stack on the tether line
- 2000A three-filter tether and volume trend system
- 2003Constructing finite volume elements as a finite-period money-flow filter
- 2003Constructing on-balance volume from signed session volume
- 2003On-balance volume as a market-breadth participation ledger
- 2003Construct a volatility-adjusted on-balance volume filter before confirming a breakout
- 2004Opening and midday ranges as an on-balance-volume breakout case
- 2004Constructing a volatility-gated volume-flow measure
- 2004Constructing a volume-flow series from on-balance volume
- 2004Volume-flow indicator construction from on-balance volume
- 2004Volume-flow slope divergence, then separate on-balance-volume and crossover rules
- 2004Volume flow and band construction as one inspectable problem
- 2004Auditing advance-decline confirmation for scale, horizon, and composition
- 2005Bounded market breadth from the Arms index to BRIN
- 2006Overnight-hold entry and exit construction
- 2007Evaluating Volume-price confirmation versus On-balance volume and MACD
- 2009Volume confirmation versus a price advance
- 2010Typeahead retrieval of a moving average, on-balance volume, and a stochastic oscillator
- 2010Modified volume-price trend and log-price scale alignment
- 2010Constructing liquidity accelerometers from advance-decline averages
- 2012Failed short cycles as breadth and volume tests
- 2016Earnings straddles, implied volatility, and money-flow filters
- 2017A volume residual filter and a price projection matrix
- 2019Volume-volatility parabola and signed-volume momentum
- 2019Separating on-balance volume into breadth and volume
- 2020Constructing the obvm signal line
- 2020Constructing smoothed on-balance volume with a signal line
- 2020Keep neutrality as a first-class input in three-state market data