2019issue C1222-25
Separating on-balance volume into breadth and volume
On-balance volume is a volume-weighted breadth series, not a money-flow reading that uses the size of the price change. Isolate the up-versus-down-day carrier first, then ask whether the volume overlay leads, lags, or only confirms price before treating a divergence as a volume signal.
- On-balance volume assigns a session's entire volume as positive or negative from whether the close is above or below the prior close, so the series responds to price direction rather than to the size of the price change.
- A parallel cumulative series that adds only plus one or minus one for each higher or lower close isolates the advance/decline carrier that on-balance volume then weights by volume.
- A price low that on-balance volume fails to confirm can come entirely from an improving breadth carrier even while the residual volume component makes a new low with price.
- Expressing on-balance volume as a full stochastic over a chosen lookback reduces the lasting effect of volume spikes and converts the series into a bounded reading that can be tracked on one security or compared across securities.
What the line actually records
On-balance volume assigns a session's entire volume as positive or negative solely from whether the close is above or below the prior close. The series therefore responds to price direction rather than to the size of the price change.
The construction is a running sum of signed volume from the start of the series. A session with volume 10 or 20 times its typical level can warp the line for a long stretch afterward.
Absolute on-balance volume readings are not a cross-security strength measure. Raw volume scales differ from one listing to another, and the series has no built-in normalized range.
Isolate the breadth carrier first
A parallel cumulative series that adds only plus one or minus one for each higher or lower close isolates the advance/decline, or breadth, carrier that on-balance volume then weights by volume. That unsigned up/down-day sum is the market-breadth component inside the line.
Component separation means plotting that unsigned sum beside the volume-weighted sum. A contradiction with price can then be traced to breadth, to volume, or to both.
A failed confirmation is not automatically a volume signal
A price low that on-balance volume fails to confirm can come entirely from an improving advance/decline carrier even while the residual volume component makes a new low with price. A late-2018 real-estate fund example followed that pattern.
Where participation sits
A 25-period full stochastic applied to a one-day up/down oscillator and to on-balance volume shows whether more volume sits on advancing days or on declining days. The volume line above the breadth oscillator means participation is concentrated on advancing days. The volume line below it means participation is concentrated on declining days.
Volume-price analysis, in this workflow, is a reading of whether participation is concentrated on up days or down days, and whether that participation moves ahead of, with, or after price.
Three meanings of volume preceding price
Saying that volume precedes price can mean volume shifting before any obvious price change, a short-term volume spike at the start of a large move, or a contemporaneous link between volume and price change. Only the first sense is a true lead hypothesis.
One information-arrival view treats volume and price as nearly simultaneous responses to the same news, which leaves little room for volume to forecast later price. A competing view allows a lag when participants receive news at different times.
A bounded reading of the same series
Expressing on-balance volume as a full stochastic over a chosen lookback reduces the lasting effect of volume spikes. Stochastic normalization converts the series into a bounded reading that can be tracked on one security or compared across securities.
SMH 25-day stochastic of on-balance volume versus the advance/decline carrier
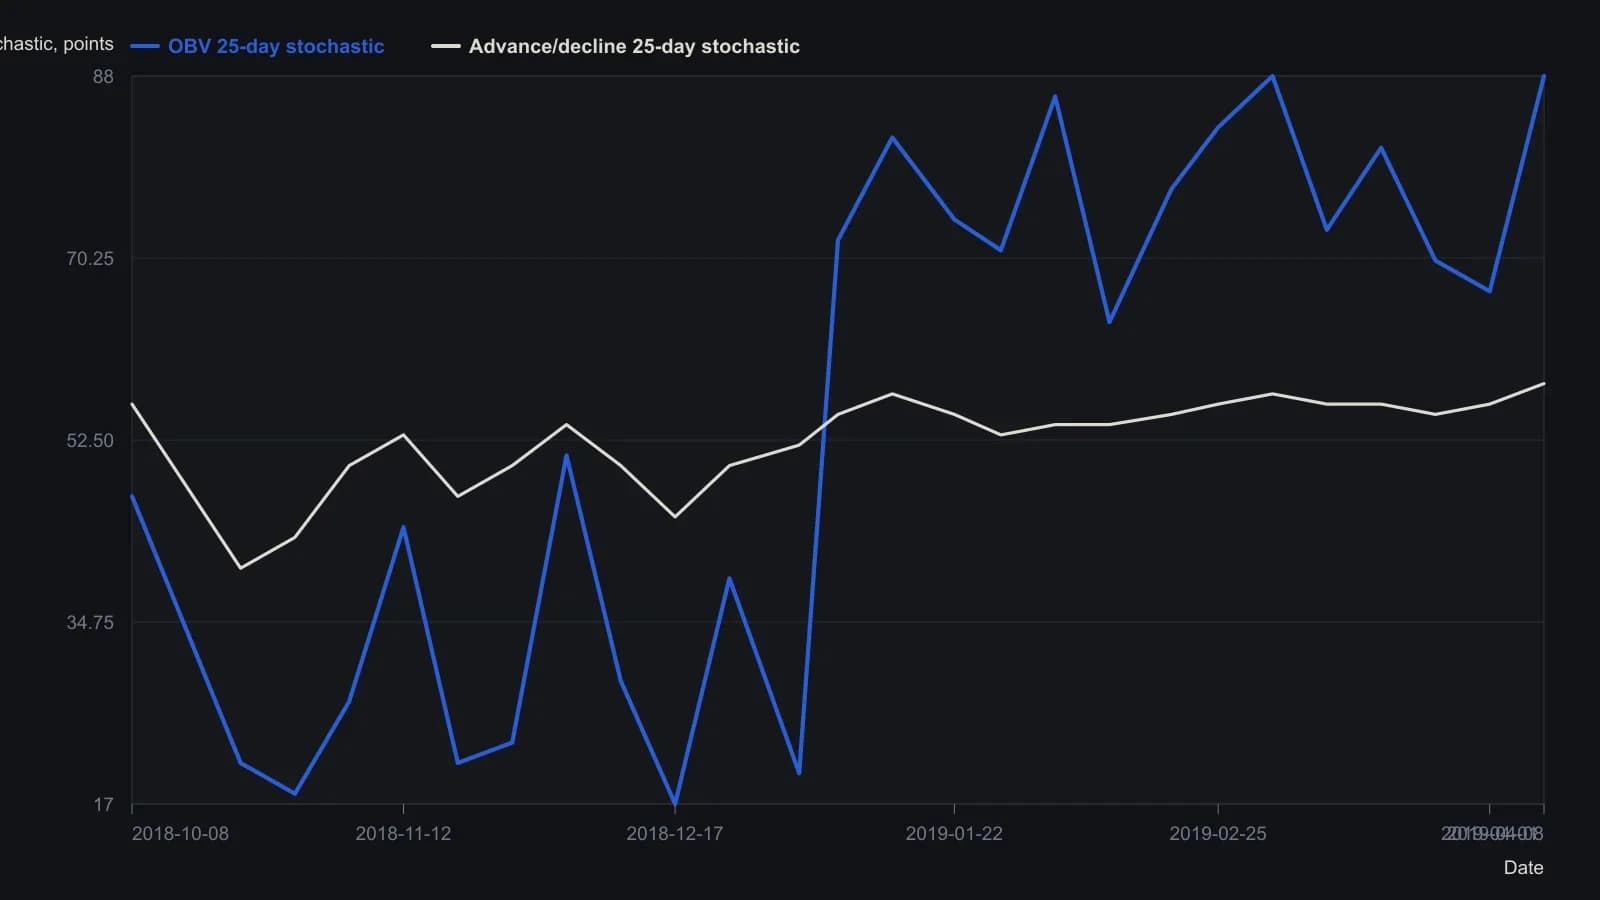
The source plotted a full stochastic of OBV at 25,1,1 (sometimes smoothed 25,2,1) against a 25,25,1 stochastic of a one-day RSI used as the advance/decline carrier. Points are weekly visual readings from the magazine raster, not the native daily series, and y-values are approximate to the nearest oscillator point.
All readings on this track · 61 readings
- 1988Cumulative volume trend and 200-session polarity
- 1988Three clocks when cumulative volume led price
- 1988Payoff index checkpoints for open interest and divergence
- 1988Relative strength, stochastics, and on-balance volume as a turning-point stack
- 1988Signing volume by open interest change
- 1988Case study: weekly on-balance volume with trendlines and a 21-period average
- 1988Combining weekly and daily MACD divergences with on-balance volume
- 1988Restoring the original tests for market breadth, on-balance volume, and trendlines
- 1989Evaluating volume-weighted breadth extremes
- 1989Demand oscillator construction with a momentum overlay
- 1989Constructing a volume percentage ratio from advance-decline flow
- 1990Constructing net positive volume as On-balance volume
- 1990Buying-share scale with on-balance volume
- 1990Friday-filtered on-balance confirmation lines
- 1991Constructing rate-market volume breadth from on-balance volume
- 1991Building a breadth composite from on-balance volume breakouts
- 1992Constructing a rate-complex volume-breadth index
- 1992Constructing a breadth index from on-balance volume
- 1992Constructing signed market thrust from issue volume
- 1992Constructing indicator phase across averages, volume and bands
- 1993Force on-balance volume to agree with itself at slower horizons
- 1993Three transforms of market thrust from breadth and volume
- 1994Constructing a tick-line momentum oscillator
- 1994Constructing a smoothed on-balance tick momentum oscillator
- 1994Histogram confirmation and a second-series veto for MACD-family alerts
- 1994Constructing a 40-period envelope on on-balance volume
- 1996Constructing a matched percent-B volume disparity
- 1997Constructing calendar regime overlays and volume-weighted rules
- 1997Constructing market thrust from breadth and volume
- 1997Constructing on-balance volume as a signed running total
- 1997A three-layer construction for a signed volume-force oscillator
- 1997Constructing a range-sum volume-force oscillator
- 1999On-balance volume confirmation, price-indicator divergence, and bounded exits
- 2000A daily long-only confirmation stack on the tether line
- 2000A three-filter tether and volume trend system
- 2003Constructing finite volume elements as a finite-period money-flow filter
- 2003Constructing on-balance volume from signed session volume
- 2003On-balance volume as a market-breadth participation ledger
- 2003Construct a volatility-adjusted on-balance volume filter before confirming a breakout
- 2004Opening and midday ranges as an on-balance-volume breakout case
- 2004Constructing a volatility-gated volume-flow measure
- 2004Constructing a volume-flow series from on-balance volume
- 2004Volume-flow indicator construction from on-balance volume
- 2004Volume-flow slope divergence, then separate on-balance-volume and crossover rules
- 2004Volume flow and band construction as one inspectable problem
- 2004Auditing advance-decline confirmation for scale, horizon, and composition
- 2005Bounded market breadth from the Arms index to BRIN
- 2006Overnight-hold entry and exit construction
- 2007Evaluating Volume-price confirmation versus On-balance volume and MACD
- 2009Volume confirmation versus a price advance
- 2010Typeahead retrieval of a moving average, on-balance volume, and a stochastic oscillator
- 2010Modified volume-price trend and log-price scale alignment
- 2010Constructing liquidity accelerometers from advance-decline averages
- 2012Failed short cycles as breadth and volume tests
- 2016Earnings straddles, implied volatility, and money-flow filters
- 2017A volume residual filter and a price projection matrix
- 2019Volume-volatility parabola and signed-volume momentum
- 2019Separating on-balance volume into breadth and volume
- 2020Constructing the obvm signal line
- 2020Constructing smoothed on-balance volume with a signal line
- 2020Keep neutrality as a first-class input in three-state market data