1988issue C011-6
Three clocks when cumulative volume led price
A 1986-1987 Dow walkthrough that treats the cumulative-volume line as the lead clock, price as the lagging clock, and transports plus the advance-decline index as confirmation, then counts session-lead so a breakout stays a testable hypothesis.
- Read the cumulative-volume line first. In September 1986 it printed a new high, a higher-low, and then a sustained October high while the Dow was still falling back toward its base.
- Count session-lead at each turn so the lag from a volume event to the matching price high or low stays a numbered disagreement, not a narrative.
- Keep S&P Transports cumulative volume and the NYSE advance-decline index as confirmation clocks beside the Dow, including when they refuse a new price high.
- After the 1987 advance, price standing well above the cumulative-volume line is a volume-price-analysis stretch. The archive framed that gap as needing more upside volume or a sizable price decline.
How the three clocks are assigned
This archive walkthrough uses a 1986 and 1987 sequence on the Dow Jones Industrial Average to show how a cumulative-volume line can print highs and lows before price. The line used here is on-balance volume, a running total of volume added on up periods and subtracted on down periods, plotted against the index so a reader can mark breakouts, a higher-low, and a session-lead versus price.
Editorial checklist: read an index turn on three clocks. Cumulative volume is the lead clock. Price is the lagging clock. Transports and the advance-decline index are the confirmation clocks. Volume-price analysis then asks whether the volume structure is holding, breaking, or stretching relative to the same market price structure. Divergence is the split in timing or direction that makes those clocks disagree. Count the session-lead so a breakout stays a falsifiable hypothesis rather than a story.
When the Dow fell back and the volume line held
DJIA cumulative volume printed a new high in September 1986, pulled back to a higher-low that same month, then made a sustained new high in October and another new high in December. On September 11 and 12, 1986 the DJIA fell 121 points back toward its base while cumulative volume stayed well above its own base, then broke to a sustained new high in October.
During the March through September 1986 range, Dow cumulative volume made a new high of 1062 on September 4, a higher-low of 978 on September 12, and a new high of 1070 on October 27, 24 trading sessions before the DJIA high of 1956 on December 2. The comparison is the volume-price-analysis point: price was still falling back toward its base while the volume line held a higher-low and then broke out first.
Transports and the advance-decline index as confirmation
S&P Transports failed to confirm new DJIA highs for months and drifted lower from April to July 1986. That refused confirmation is divergence between the industrial price highs and the transport line. On September 12, 1986 the transports index printed 181.86 near a prior low of 176.16 while its cumulative volume held far above its low and then made a new high in October with DJIA cumulative volume.
The NYSE advance-decline index peaked in April 1986, eased into August, rallied into November, and made a final low on December 31, 1986, then took 21 trading sessions to reach a new high in early February 1987. Editorial use: keep this breadth line as a confirmation clock beside the Dow, not as a substitute for the cumulative-volume lead.
Three session-leads after July 1985
After July 1985, Dow cumulative volume led price at three documented turns, including a volume high of 754 on August 29 versus a price high of 1369 on October 16, 32 trading sessions later.
In spring 1987 the Dow price low of 2216 on May 20 trailed a cumulative-volume low of 1393 on April 27. Price then broke out to 2407 on June 16, 28 sessions after the May 5 cumulative-volume high of 1475. By the May 20, 1987 Dow short-term low, DJIA cumulative volume was already in new-high ground after a May 5 breakout, and S&P Transports cumulative volume printed a confirming new high on May 6.
Session lead of Dow cumulative volume over price
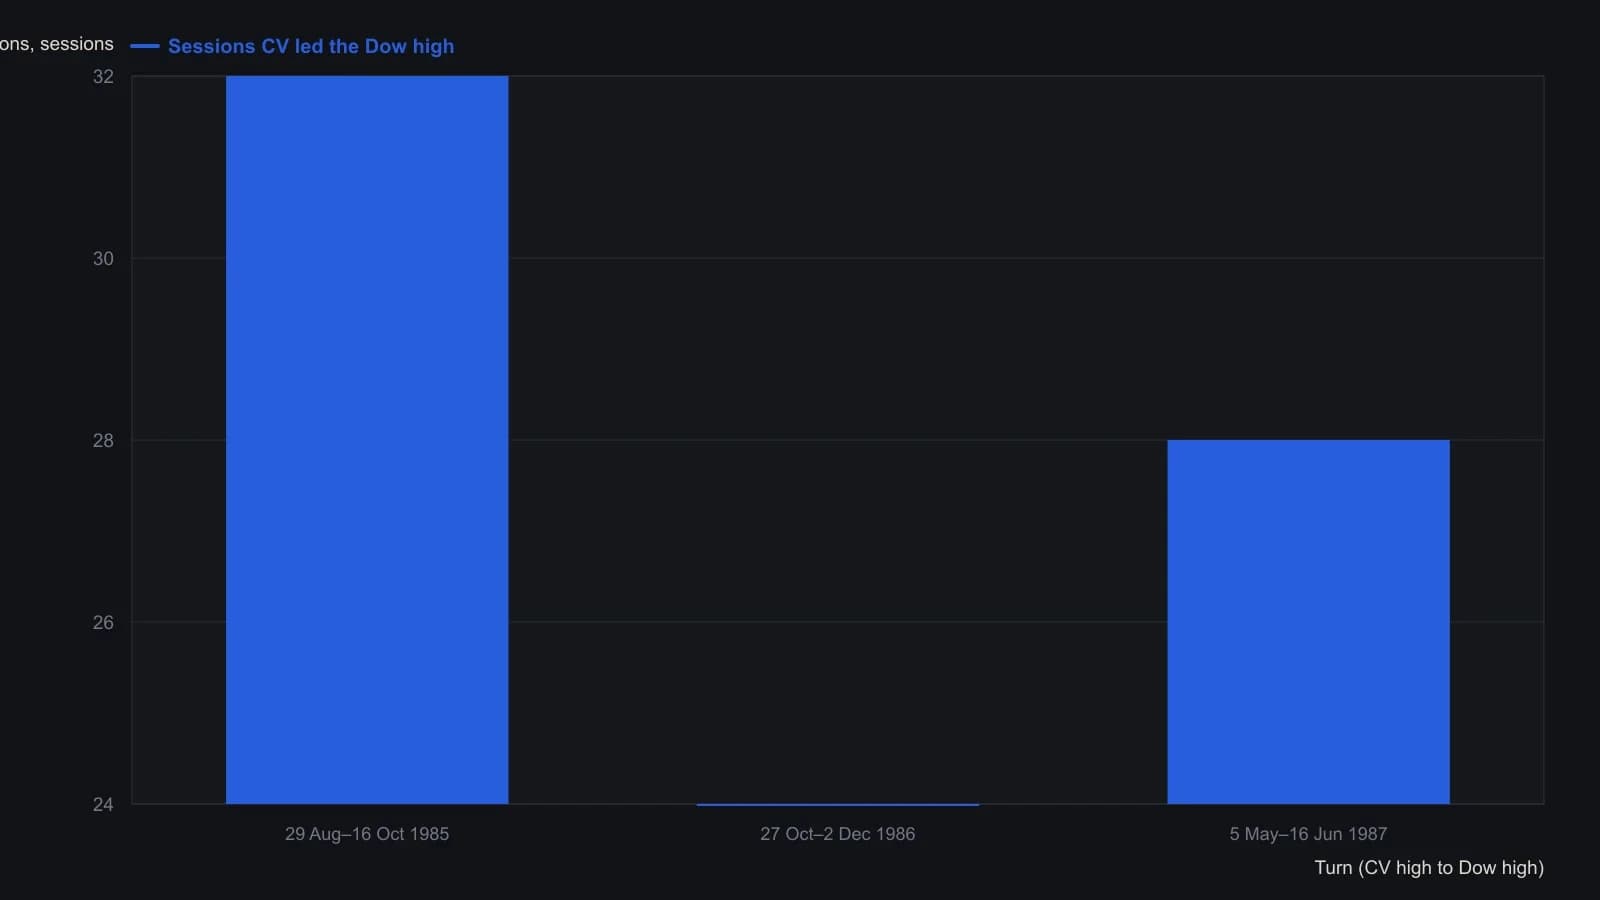
Each bar is the trading-session gap Thomson reports between a named Dow cumulative-volume high and the later Dow price high: 754 on 29 Aug 1985 versus 1369 on 16 Oct 1985; 1070 on 27 Oct 1986 versus 1956 on 2 Dec 1986; 1475 on 5 May 1987 versus 2407 on 16 Jun 1987.
Price above the cumulative-volume line
After that 1987 advance, Dow price stood well above its cumulative-volume line. The archive write-up framed the gap as needing either more upside volume or a sizable price decline, and noted that cumulative volume was again resisting during the sell-off then under way. Editorial reading: that stretch is volume-price analysis after the lead has already printed, not a new first signal.
All readings on this track · 61 readings
- 1988Cumulative volume trend and 200-session polarity
- 1988Three clocks when cumulative volume led price
- 1988Payoff index checkpoints for open interest and divergence
- 1988Relative strength, stochastics, and on-balance volume as a turning-point stack
- 1988Signing volume by open interest change
- 1988Case study: weekly on-balance volume with trendlines and a 21-period average
- 1988Combining weekly and daily MACD divergences with on-balance volume
- 1988Restoring the original tests for market breadth, on-balance volume, and trendlines
- 1989Evaluating volume-weighted breadth extremes
- 1989Demand oscillator construction with a momentum overlay
- 1989Constructing a volume percentage ratio from advance-decline flow
- 1990Constructing net positive volume as On-balance volume
- 1990Buying-share scale with on-balance volume
- 1990Friday-filtered on-balance confirmation lines
- 1991Constructing rate-market volume breadth from on-balance volume
- 1991Building a breadth composite from on-balance volume breakouts
- 1992Constructing a rate-complex volume-breadth index
- 1992Constructing a breadth index from on-balance volume
- 1992Constructing signed market thrust from issue volume
- 1992Constructing indicator phase across averages, volume and bands
- 1993Force on-balance volume to agree with itself at slower horizons
- 1993Three transforms of market thrust from breadth and volume
- 1994Constructing a tick-line momentum oscillator
- 1994Constructing a smoothed on-balance tick momentum oscillator
- 1994Histogram confirmation and a second-series veto for MACD-family alerts
- 1994Constructing a 40-period envelope on on-balance volume
- 1996Constructing a matched percent-B volume disparity
- 1997Constructing calendar regime overlays and volume-weighted rules
- 1997Constructing market thrust from breadth and volume
- 1997Constructing on-balance volume as a signed running total
- 1997A three-layer construction for a signed volume-force oscillator
- 1997Constructing a range-sum volume-force oscillator
- 1999On-balance volume confirmation, price-indicator divergence, and bounded exits
- 2000A daily long-only confirmation stack on the tether line
- 2000A three-filter tether and volume trend system
- 2003Constructing finite volume elements as a finite-period money-flow filter
- 2003Constructing on-balance volume from signed session volume
- 2003On-balance volume as a market-breadth participation ledger
- 2003Construct a volatility-adjusted on-balance volume filter before confirming a breakout
- 2004Opening and midday ranges as an on-balance-volume breakout case
- 2004Constructing a volatility-gated volume-flow measure
- 2004Constructing a volume-flow series from on-balance volume
- 2004Volume-flow indicator construction from on-balance volume
- 2004Volume-flow slope divergence, then separate on-balance-volume and crossover rules
- 2004Volume flow and band construction as one inspectable problem
- 2004Auditing advance-decline confirmation for scale, horizon, and composition
- 2005Bounded market breadth from the Arms index to BRIN
- 2006Overnight-hold entry and exit construction
- 2007Evaluating Volume-price confirmation versus On-balance volume and MACD
- 2009Volume confirmation versus a price advance
- 2010Typeahead retrieval of a moving average, on-balance volume, and a stochastic oscillator
- 2010Modified volume-price trend and log-price scale alignment
- 2010Constructing liquidity accelerometers from advance-decline averages
- 2012Failed short cycles as breadth and volume tests
- 2016Earnings straddles, implied volatility, and money-flow filters
- 2017A volume residual filter and a price projection matrix
- 2019Volume-volatility parabola and signed-volume momentum
- 2019Separating on-balance volume into breadth and volume
- 2020Constructing the obvm signal line
- 2020Constructing smoothed on-balance volume with a signal line
- 2020Keep neutrality as a first-class input in three-state market data