1988issue C011-7
Cumulative volume trend and 200-session polarity
Editorial reading: a three-condition chart hypothesis that treats the 200-session average as a polarity line, uses the slope of on-balance cumulative volume to confirm or reject a test of that line, and checks short interest before reading a volume-price surge as genuine demand.
- Co-plot the cumulative volume line with price on a proportioned, adjustable scale and re-tie the coincidence point so tracking and divergence can be judged on any chart segment.
- Read the 200-session average as a polarity line: rising support after a confirmed upside shift, a moving ceiling after a break and a failed bounce.
- Let the slope of on-balance volume, made clearer by channel-trend breaks, confirm or reject a test of that average. A change in the volume-total trend is the cue for a change in price direction.
- Check short interest before treating a volume-price surge as genuine demand. Covering can lift price and the cumulative total, then leave a sharp drop with little further change in that total.
A three-condition chart hypothesis
Editorial reading: TradersWeek frames the archive workflow as a three-condition chart hypothesis. First, treat the 200-session average as a polarity line. Second, use the slope of on-balance volume, the cumulative, directionally signed volume line, to confirm or reject a test of that line. Third, check short interest before treating a volume-price surge as genuine demand.
The method states that the trend of cumulative volume confirms a price trend versus the 200-session average, while a change in that volume-total trend is the cue for a change in price direction.
Scale and the coincidence point
A cumulative volume line is treated as usable only when it is co-plotted with price on a proportioned, adjustable scale that can be re-tied at a chosen coincidence point so tracking and divergence can be inspected on any chart segment.
The coincidence point is the chart location where the cumulative-volume scale is tied to price so the two series can be forced to track on a chosen interval. Volume-price analysis is that joint reading of price structure and the co-plotted volume total, including scale choice and the movable coincidence point.
The 200-session average as a polarity line
The moving average here is the 200-session average, used as a dynamic support or resistance line and as a simple above-or-below regime classifier.
In a declining-to-rising regime, price may first stall at a falling 200-session average, then pierce it, retest it more than once, and later ride that average as rising support once the average itself flattens and turns up.
An upside penetration of the 200-session average that occurs with an exceptionally strong cumulative-volume channel, after earlier failed attempts, is presented as the volume-price condition that later allows a return to that average to be treated as support.
In a rising-to-declining regime, price may lean on a rising 200-session average for repeated support until a break below is followed by a failed bounce that turns the now-flattening, then falling, average into a moving ceiling.
Slope, divergence, and channel-trend
On-balance volume is the volume-price running total. Its slope and channel-defined turns are the timing layer, not isolated daily volume spikes.
A steep rise in cumulative volume can accompany a lift of price through the 200-session average. When that volume thrust eases, the cumulative-volume slope flattens and price can fall back to the average.
Price holding a 200-session average while cumulative volume is weak or falling is presented as a divergence. After a break below the average, a failed rally back to it is treated as a completed bearish polarity shift.
Channel lines drawn on cumulative volume are used to mark each turn in the volume-total direction more clearly than the raw cumulative line alone. Channel-trend means those parallel bounds, so each change in volume-total direction is visible as a channel break rather than a vague curve.
Xerox closing price versus the 200-session average, August 1983–February 1985
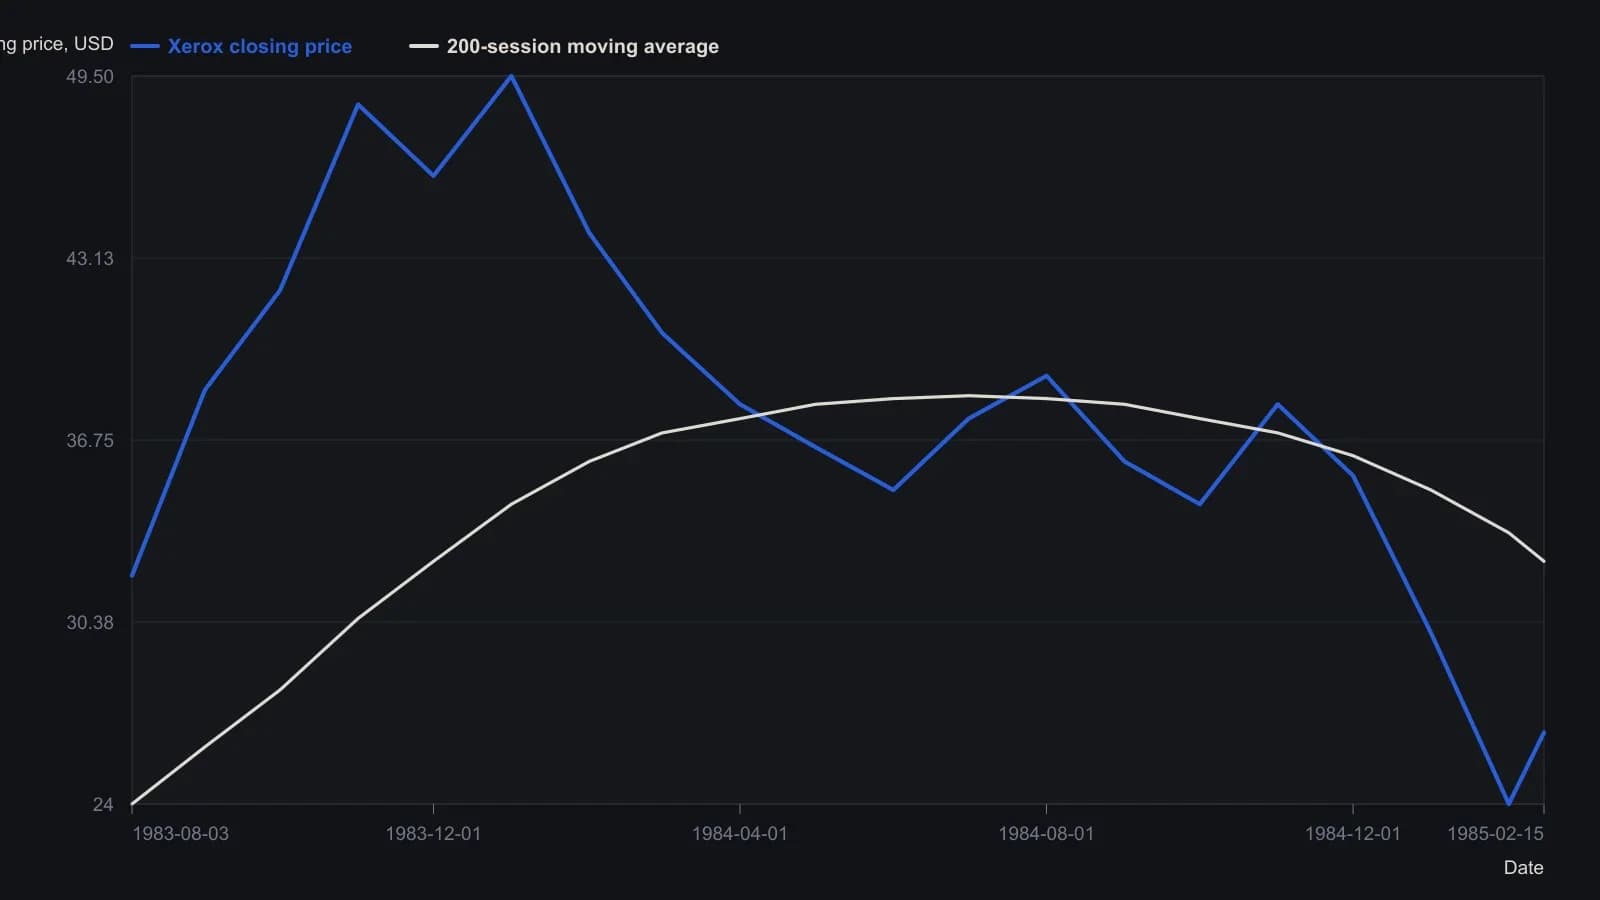
Values are approximate weekly samples from a scanned daily chart (8/3/83–2/15/85). Axis ticks are 54, 38, 22 and 6 dollars; last printed close is 42 5/8. Channel and cumulative-volume overlays on the companion Xerox plate were not digitized here.
Short-interest-distortion
High or rising short interest can force a rapid rise in both price and cumulative volume that resembles genuine demand. After covering reduces that short base, price can fall sharply while cumulative volume changes little.
That covering-driven pattern is short-interest-distortion: a rise in price and cumulative volume that can look like fresh demand, then reverse into a sharp price drop with little further change in the volume total once the short base is spent.
One illustrated spike combined an initial above-average volume advance with a second rise of more than 10 points on large daily volume at the same time short interest dropped sharply.
All readings on this track · 61 readings
- 1988Cumulative volume trend and 200-session polarity
- 1988Three clocks when cumulative volume led price
- 1988Payoff index checkpoints for open interest and divergence
- 1988Relative strength, stochastics, and on-balance volume as a turning-point stack
- 1988Signing volume by open interest change
- 1988Case study: weekly on-balance volume with trendlines and a 21-period average
- 1988Combining weekly and daily MACD divergences with on-balance volume
- 1988Restoring the original tests for market breadth, on-balance volume, and trendlines
- 1989Evaluating volume-weighted breadth extremes
- 1989Demand oscillator construction with a momentum overlay
- 1989Constructing a volume percentage ratio from advance-decline flow
- 1990Constructing net positive volume as On-balance volume
- 1990Buying-share scale with on-balance volume
- 1990Friday-filtered on-balance confirmation lines
- 1991Constructing rate-market volume breadth from on-balance volume
- 1991Building a breadth composite from on-balance volume breakouts
- 1992Constructing a rate-complex volume-breadth index
- 1992Constructing a breadth index from on-balance volume
- 1992Constructing signed market thrust from issue volume
- 1992Constructing indicator phase across averages, volume and bands
- 1993Force on-balance volume to agree with itself at slower horizons
- 1993Three transforms of market thrust from breadth and volume
- 1994Constructing a tick-line momentum oscillator
- 1994Constructing a smoothed on-balance tick momentum oscillator
- 1994Histogram confirmation and a second-series veto for MACD-family alerts
- 1994Constructing a 40-period envelope on on-balance volume
- 1996Constructing a matched percent-B volume disparity
- 1997Constructing calendar regime overlays and volume-weighted rules
- 1997Constructing market thrust from breadth and volume
- 1997Constructing on-balance volume as a signed running total
- 1997A three-layer construction for a signed volume-force oscillator
- 1997Constructing a range-sum volume-force oscillator
- 1999On-balance volume confirmation, price-indicator divergence, and bounded exits
- 2000A daily long-only confirmation stack on the tether line
- 2000A three-filter tether and volume trend system
- 2003Constructing finite volume elements as a finite-period money-flow filter
- 2003Constructing on-balance volume from signed session volume
- 2003On-balance volume as a market-breadth participation ledger
- 2003Construct a volatility-adjusted on-balance volume filter before confirming a breakout
- 2004Opening and midday ranges as an on-balance-volume breakout case
- 2004Constructing a volatility-gated volume-flow measure
- 2004Constructing a volume-flow series from on-balance volume
- 2004Volume-flow indicator construction from on-balance volume
- 2004Volume-flow slope divergence, then separate on-balance-volume and crossover rules
- 2004Volume flow and band construction as one inspectable problem
- 2004Auditing advance-decline confirmation for scale, horizon, and composition
- 2005Bounded market breadth from the Arms index to BRIN
- 2006Overnight-hold entry and exit construction
- 2007Evaluating Volume-price confirmation versus On-balance volume and MACD
- 2009Volume confirmation versus a price advance
- 2010Typeahead retrieval of a moving average, on-balance volume, and a stochastic oscillator
- 2010Modified volume-price trend and log-price scale alignment
- 2010Constructing liquidity accelerometers from advance-decline averages
- 2012Failed short cycles as breadth and volume tests
- 2016Earnings straddles, implied volatility, and money-flow filters
- 2017A volume residual filter and a price projection matrix
- 2019Volume-volatility parabola and signed-volume momentum
- 2019Separating on-balance volume into breadth and volume
- 2020Constructing the obvm signal line
- 2020Constructing smoothed on-balance volume with a signal line
- 2020Keep neutrality as a first-class input in three-state market data