2004issue C061-7
Constructing a volume-flow series from on-balance volume
Rebuild on-balance volume into a long-horizon money-flow series by changing the price input, adding a volatility cutoff, and using linear-regression slope as a noise filter. State a price-indicator divergence and zero-line sequence as a construction that can be checked, not as a story about one chart.
- The volume-flow construction revises on-balance volume on indicator values, historical segment, short- and intermediate-term predictive use, huge-volume days, minimal price changes, and calculation method.
- Typical price, the average of high, low, and close, decides whether money flowed in or out, and a minimal-change cutoff withholds a full volume increment when the interday move is too small.
- Short-term direction is judged with a 15-day linear-regression line, intermediate trends with a five-week line or rate of change, and long-term trends with a 50-week line or rate of change.
- On the way down, the specified sequence is divergence, then a sharp change in direction, then a zero-line cross, with the 15-day linear-regression angle at -30 degrees or less.
What the revision is trying to change
The volume-flow construction is presented as a revision of on-balance volume. It targets indicator values, the historical segment, short- and intermediate-term predictive use, huge-volume days, minimal price changes, and the calculation method.
The on-balance volume increment
On-balance volume adds or subtracts the full day's volume from a running total according to whether the close is above or below the prior close. That rule credits even a one-cent close change with the entire session volume.
Typical price and a minimal-change cutoff
The revised series uses typical price, defined as high plus low plus close divided by three, as the day-to-day input for deciding whether money flowed in or out. A volatility threshold is added so minimal interday price changes do not move the series by the full day's volume. That threshold is the minimal-change cutoff.
Linear regression as a noise filter
A 15-day linear-regression line is used to judge short-term direction. A five-week line or rate of change is used for intermediate trends, and a 50-week line or rate of change for long-term trends.
A historical comparison on the Nasdaq
On a 2000 Nasdaq comparison chart, on-balance volume made higher highs and a positive divergence. The volume-flow series made a last high in January, then a lower high that crossed its 50-day average downward, and later stayed below that average after crossing zero.
A stated reversal sequence
On the way down, a reversal sequence is specified as divergence, then a sharp change in direction, then a zero-line cross, with the 15-day linear-regression angle at -30 degrees or less. The zero-line cross is the later confirmation step after divergence and the sharp change in direction.
A constructed sell sequence
A constructed sell sequence on Parmalat is described as divergence from A to B, a sharp drop from B to C, and a zero-line cross at D more than four months before a later collapse from 2.65 euros to 11 eurocents.
What a negative level is allowed to mean
Negative indicator level alone is treated as a reason to exit longs, not as sufficient justification to enter a short. That reading is to be cross-referenced with at least one other indicator.
What was left for a later article
Several tests of divergence, direction, and indicator-level signals, plus a new divergence-detection method, were reserved for a later article.
Parmalat 130-day volume flow versus the zero line
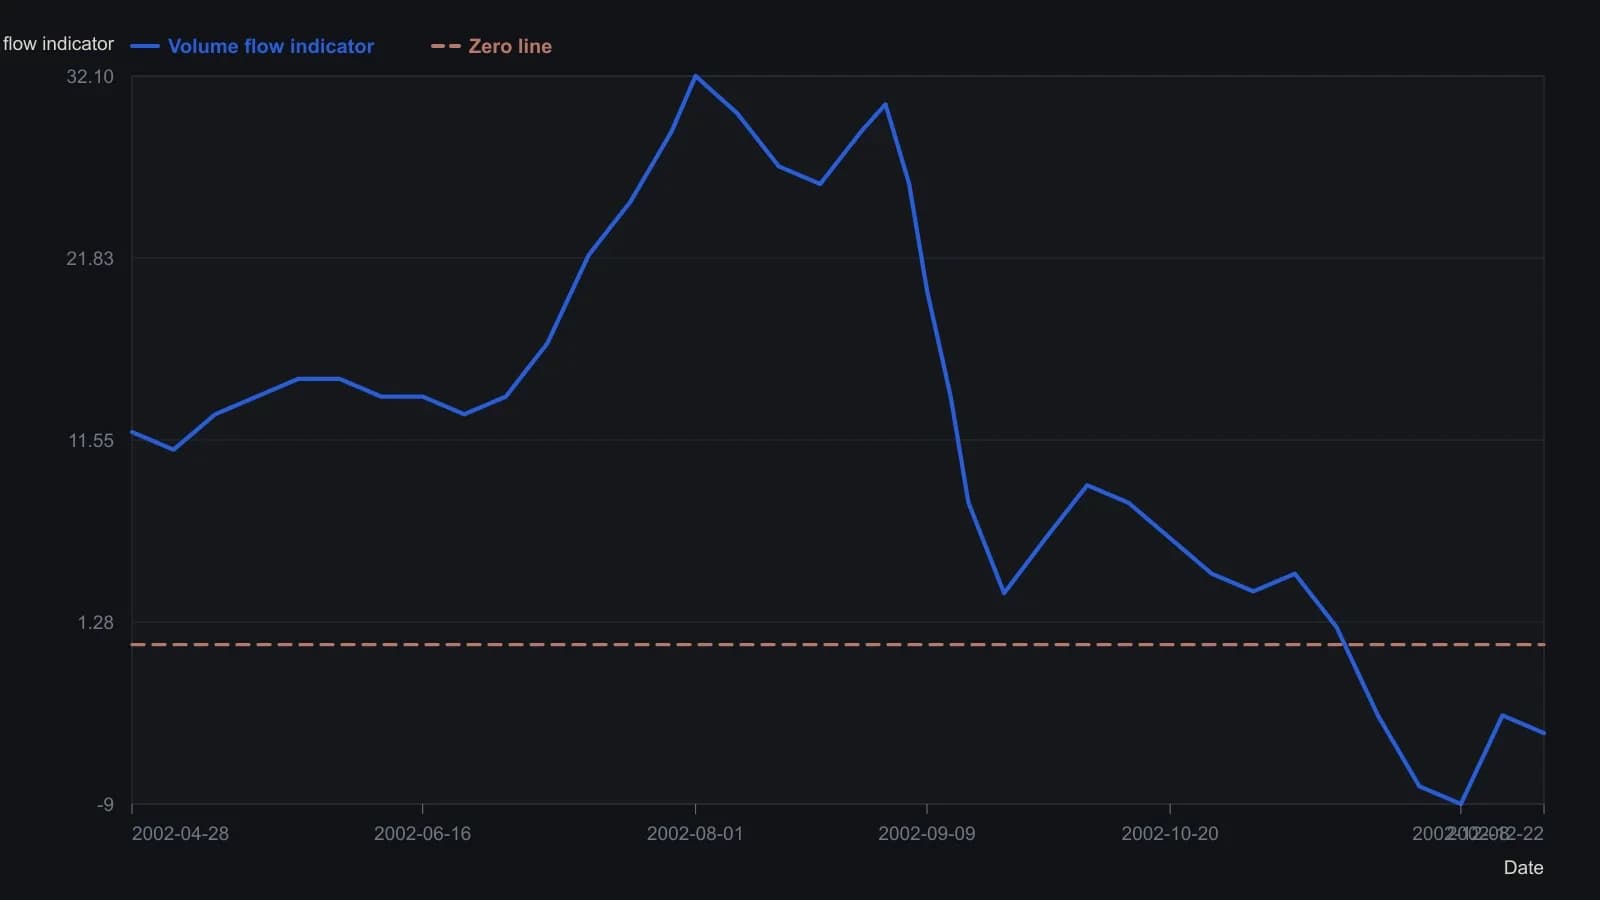
Default construction is 130-day VFI, 3-day EMA, a 0.2 interday-volatility cutoff on typical price, and volume capped at 2.5 times its lagged average. Y-scale is anchored to the three labeled highs and to the pane zero line; unmarked points are approximate. The source dates A and B as 1 August and 2 September 2002 on a May–December axis.
All readings on this track · 61 readings
- 1988Cumulative volume trend and 200-session polarity
- 1988Three clocks when cumulative volume led price
- 1988Payoff index checkpoints for open interest and divergence
- 1988Relative strength, stochastics, and on-balance volume as a turning-point stack
- 1988Signing volume by open interest change
- 1988Case study: weekly on-balance volume with trendlines and a 21-period average
- 1988Combining weekly and daily MACD divergences with on-balance volume
- 1988Restoring the original tests for market breadth, on-balance volume, and trendlines
- 1989Evaluating volume-weighted breadth extremes
- 1989Demand oscillator construction with a momentum overlay
- 1989Constructing a volume percentage ratio from advance-decline flow
- 1990Constructing net positive volume as On-balance volume
- 1990Buying-share scale with on-balance volume
- 1990Friday-filtered on-balance confirmation lines
- 1991Constructing rate-market volume breadth from on-balance volume
- 1991Building a breadth composite from on-balance volume breakouts
- 1992Constructing a rate-complex volume-breadth index
- 1992Constructing a breadth index from on-balance volume
- 1992Constructing signed market thrust from issue volume
- 1992Constructing indicator phase across averages, volume and bands
- 1993Force on-balance volume to agree with itself at slower horizons
- 1993Three transforms of market thrust from breadth and volume
- 1994Constructing a tick-line momentum oscillator
- 1994Constructing a smoothed on-balance tick momentum oscillator
- 1994Histogram confirmation and a second-series veto for MACD-family alerts
- 1994Constructing a 40-period envelope on on-balance volume
- 1996Constructing a matched percent-B volume disparity
- 1997Constructing calendar regime overlays and volume-weighted rules
- 1997Constructing market thrust from breadth and volume
- 1997Constructing on-balance volume as a signed running total
- 1997A three-layer construction for a signed volume-force oscillator
- 1997Constructing a range-sum volume-force oscillator
- 1999On-balance volume confirmation, price-indicator divergence, and bounded exits
- 2000A daily long-only confirmation stack on the tether line
- 2000A three-filter tether and volume trend system
- 2003Constructing finite volume elements as a finite-period money-flow filter
- 2003Constructing on-balance volume from signed session volume
- 2003On-balance volume as a market-breadth participation ledger
- 2003Construct a volatility-adjusted on-balance volume filter before confirming a breakout
- 2004Opening and midday ranges as an on-balance-volume breakout case
- 2004Constructing a volatility-gated volume-flow measure
- 2004Constructing a volume-flow series from on-balance volume
- 2004Volume-flow indicator construction from on-balance volume
- 2004Volume-flow slope divergence, then separate on-balance-volume and crossover rules
- 2004Volume flow and band construction as one inspectable problem
- 2004Auditing advance-decline confirmation for scale, horizon, and composition
- 2005Bounded market breadth from the Arms index to BRIN
- 2006Overnight-hold entry and exit construction
- 2007Evaluating Volume-price confirmation versus On-balance volume and MACD
- 2009Volume confirmation versus a price advance
- 2010Typeahead retrieval of a moving average, on-balance volume, and a stochastic oscillator
- 2010Modified volume-price trend and log-price scale alignment
- 2010Constructing liquidity accelerometers from advance-decline averages
- 2012Failed short cycles as breadth and volume tests
- 2016Earnings straddles, implied volatility, and money-flow filters
- 2017A volume residual filter and a price projection matrix
- 2019Volume-volatility parabola and signed-volume momentum
- 2019Separating on-balance volume into breadth and volume
- 2020Constructing the obvm signal line
- 2020Constructing smoothed on-balance volume with a signal line
- 2020Keep neutrality as a first-class input in three-state market data