1990issue C121-2
Friday-filtered on-balance confirmation lines
A friday-filter admits only Friday observations into two session series and accumulates each as an on-balance-line against the weekly close. Editorial reading: that gate turns a weekly price high into a confirmation test on the intermediate-horizon rather than a standalone trend signal.
- A client poll named Friday as the week's most important session, so the archive restricted two indicators to Friday observations and treated that friday-filter as the first construction rule.
- Each Friday series, the New York Stock Exchange tick close and the last-hour-first-hour-residual, was accumulated into an on-balance-line and plotted against the weekly DJIA close over 22 weeks.
- On an intermediate-horizon of four to six weeks, neither filtered line confirmed the weekly DJIA closing high of July 20, 1990: the tick line formed a triple top and the residual line formed declining tops.
- Editorial reading: the weekday-restricted on-balance series is a trend-filter. A weekly high is accepted or rejected by confirmation-divergence, not read as a trend signal on its own.
The friday-filter as the first construction rule
The archive workflow began with a client poll that named Friday most often as the week's most important session. Of 297 questionnaires sent, 218 were returned: 83 percent chose Friday, 14 percent Monday, 2 percent named no preferred day, and 1 percent chose Tuesday, Wednesday, or Thursday.
A friday-filter was then built by restricting two indicators to Friday observations. Under that rule the series represents a chosen session rather than every trading day.
Two Friday inputs become on-balance-lines
The first Friday-only input was the New York Stock Exchange tick close. The second was the last-hour-first-hour-residual: Friday's late-session DJIA change minus the same day's first 90-minute DJIA change.
Each Friday series was accumulated into an on-balance-line, a cumulative signed path built from the session statistic in an on-balance-volume style, and plotted against the weekly DJIA close over 22 weeks.
The intermediate-horizon check
The comparison horizon used for those lines was defined as an intermediate-horizon of four to six weeks. In that window the weekday-restricted on-balance series is the trend-filter: a check on whether a weekly high is accepted or rejected.
A weekly high the lines did not confirm
Neither filtered on-balance-line confirmed the weekly DJIA closing high of July 20, 1990. That pattern is confirmation-divergence: a weekly price high that the filtered on-balance-line does not confirm.
Into that weekly high, the Friday tick on-balance-line formed a triple top and the last-hour-first-hour-residual line formed declining tops. On Friday, July 20, 1990 the DJIA declined 36 points, then declined another 54 points by the following Monday's close.
Weekly DJIA and Friday tick on-balance line
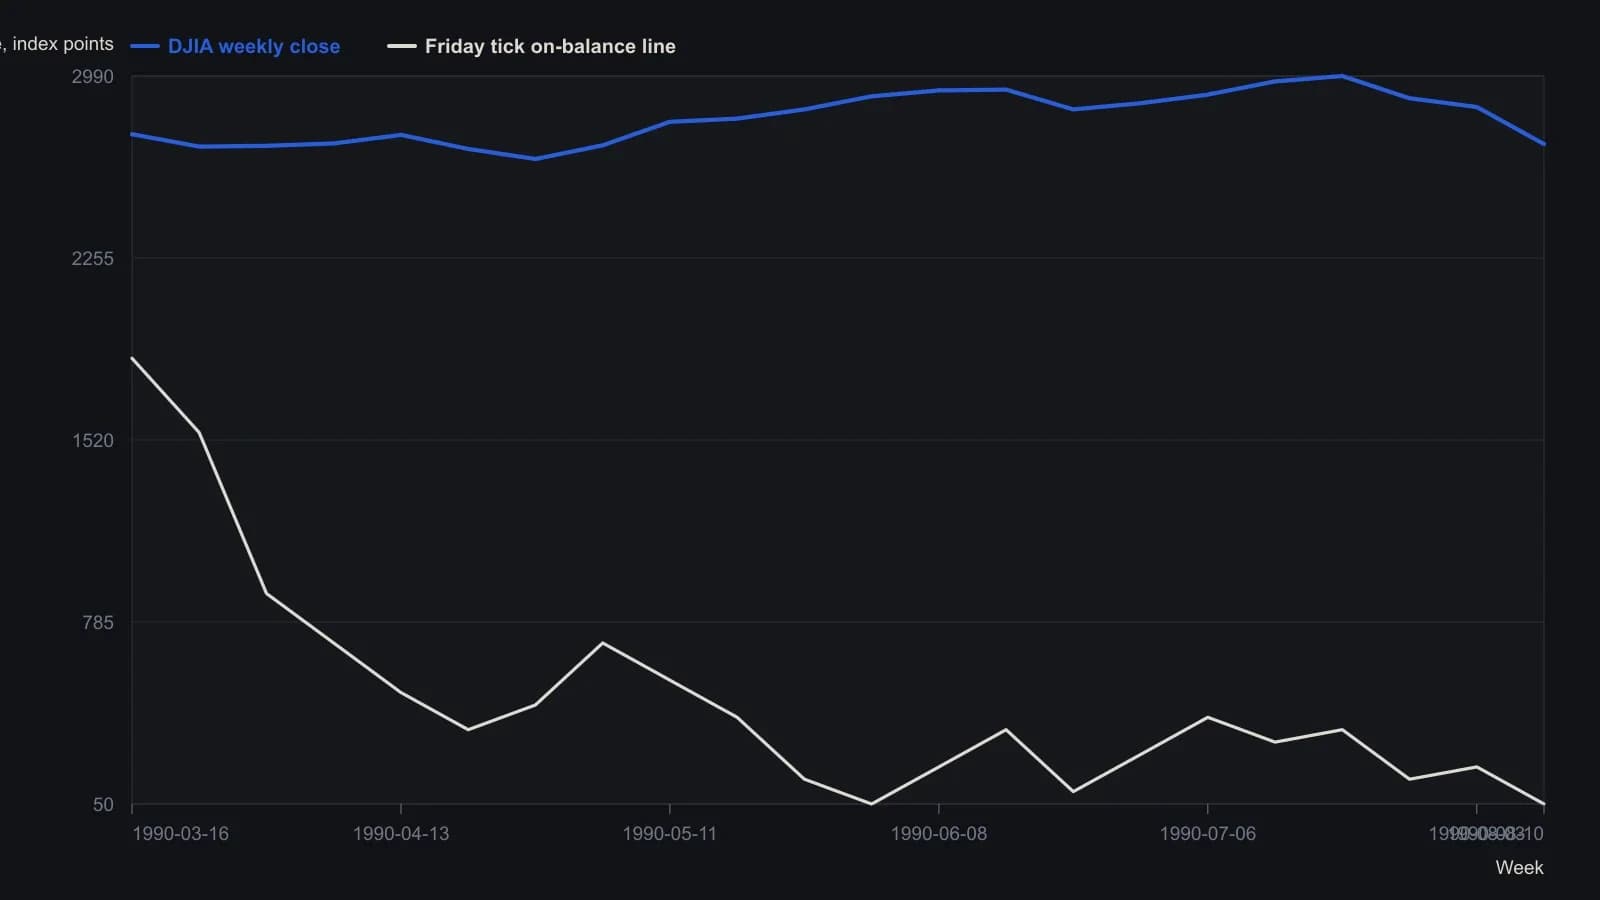
Raster is a mirrored scan of a dual-axis plot. DJIA is the left scale in index points; the Friday tick on-balance line is the right scale in tick units. Dates are week-ending Fridays approximated from the month ticks. Point count is kept modest because the scan cannot support finer precision. Article states the July 20, 1990 weekly close was unconfirmed and that the cash DJIA then fell 36 points that Friday.
All readings on this track · 61 readings
- 1988Cumulative volume trend and 200-session polarity
- 1988Three clocks when cumulative volume led price
- 1988Payoff index checkpoints for open interest and divergence
- 1988Relative strength, stochastics, and on-balance volume as a turning-point stack
- 1988Signing volume by open interest change
- 1988Case study: weekly on-balance volume with trendlines and a 21-period average
- 1988Combining weekly and daily MACD divergences with on-balance volume
- 1988Restoring the original tests for market breadth, on-balance volume, and trendlines
- 1989Evaluating volume-weighted breadth extremes
- 1989Demand oscillator construction with a momentum overlay
- 1989Constructing a volume percentage ratio from advance-decline flow
- 1990Constructing net positive volume as On-balance volume
- 1990Buying-share scale with on-balance volume
- 1990Friday-filtered on-balance confirmation lines
- 1991Constructing rate-market volume breadth from on-balance volume
- 1991Building a breadth composite from on-balance volume breakouts
- 1992Constructing a rate-complex volume-breadth index
- 1992Constructing a breadth index from on-balance volume
- 1992Constructing signed market thrust from issue volume
- 1992Constructing indicator phase across averages, volume and bands
- 1993Force on-balance volume to agree with itself at slower horizons
- 1993Three transforms of market thrust from breadth and volume
- 1994Constructing a tick-line momentum oscillator
- 1994Constructing a smoothed on-balance tick momentum oscillator
- 1994Histogram confirmation and a second-series veto for MACD-family alerts
- 1994Constructing a 40-period envelope on on-balance volume
- 1996Constructing a matched percent-B volume disparity
- 1997Constructing calendar regime overlays and volume-weighted rules
- 1997Constructing market thrust from breadth and volume
- 1997Constructing on-balance volume as a signed running total
- 1997A three-layer construction for a signed volume-force oscillator
- 1997Constructing a range-sum volume-force oscillator
- 1999On-balance volume confirmation, price-indicator divergence, and bounded exits
- 2000A daily long-only confirmation stack on the tether line
- 2000A three-filter tether and volume trend system
- 2003Constructing finite volume elements as a finite-period money-flow filter
- 2003Constructing on-balance volume from signed session volume
- 2003On-balance volume as a market-breadth participation ledger
- 2003Construct a volatility-adjusted on-balance volume filter before confirming a breakout
- 2004Opening and midday ranges as an on-balance-volume breakout case
- 2004Constructing a volatility-gated volume-flow measure
- 2004Constructing a volume-flow series from on-balance volume
- 2004Volume-flow indicator construction from on-balance volume
- 2004Volume-flow slope divergence, then separate on-balance-volume and crossover rules
- 2004Volume flow and band construction as one inspectable problem
- 2004Auditing advance-decline confirmation for scale, horizon, and composition
- 2005Bounded market breadth from the Arms index to BRIN
- 2006Overnight-hold entry and exit construction
- 2007Evaluating Volume-price confirmation versus On-balance volume and MACD
- 2009Volume confirmation versus a price advance
- 2010Typeahead retrieval of a moving average, on-balance volume, and a stochastic oscillator
- 2010Modified volume-price trend and log-price scale alignment
- 2010Constructing liquidity accelerometers from advance-decline averages
- 2012Failed short cycles as breadth and volume tests
- 2016Earnings straddles, implied volatility, and money-flow filters
- 2017A volume residual filter and a price projection matrix
- 2019Volume-volatility parabola and signed-volume momentum
- 2019Separating on-balance volume into breadth and volume
- 2020Constructing the obvm signal line
- 2020Constructing smoothed on-balance volume with a signal line
- 2020Keep neutrality as a first-class input in three-state market data