2010issue C0467-78
Modified volume-price trend and log-price scale alignment
A reduced-volume cumulative line is assembled from average-price percentage change, then aligned to a logarithmic price chart so agreement and disagreement can be read as a construction choice.
- The modified volume-price trend is a running sum of a reduced volume term times the percentage change in average price, not a signed full-volume total taken from close-to-close direction.
- Average price is the mean of open, high, low, and close, and that average replaces the close when each bar's contribution is sized.
- A logarithmic price scale, a linear indicator scale, and level and scale overlay inputs let the line be compared with the shape of price without changing the cumulative calculation.
- Agreement between the two paths is the intended visual test of confirmation, and a split is the intended visual test of Price-indicator divergence.
What the line accumulates
The modified volume-price trend line is built as a running sum of a reduced volume term times the percentage change in average price. That design is presented as a modification of On-balance volume. The signed full-volume accumulator is replaced by a percentage-change-weighted reduced-volume accumulator, rather than adding or subtracting full bar volume from a close-to-close sign.
Average price as the sizing input
Average price is defined as the mean of open, high, low, and close. That average replaces the close as the price input used to size each bar's contribution.
A reduced volume term on a readable scale
The reduced volume term is constructed as volume, or tick count on tick bars, multiplied by a small constant so the cumulative line stays on a readable numeric scale.
Modified volume-price trend from the four-price average, 3–26 January 1995
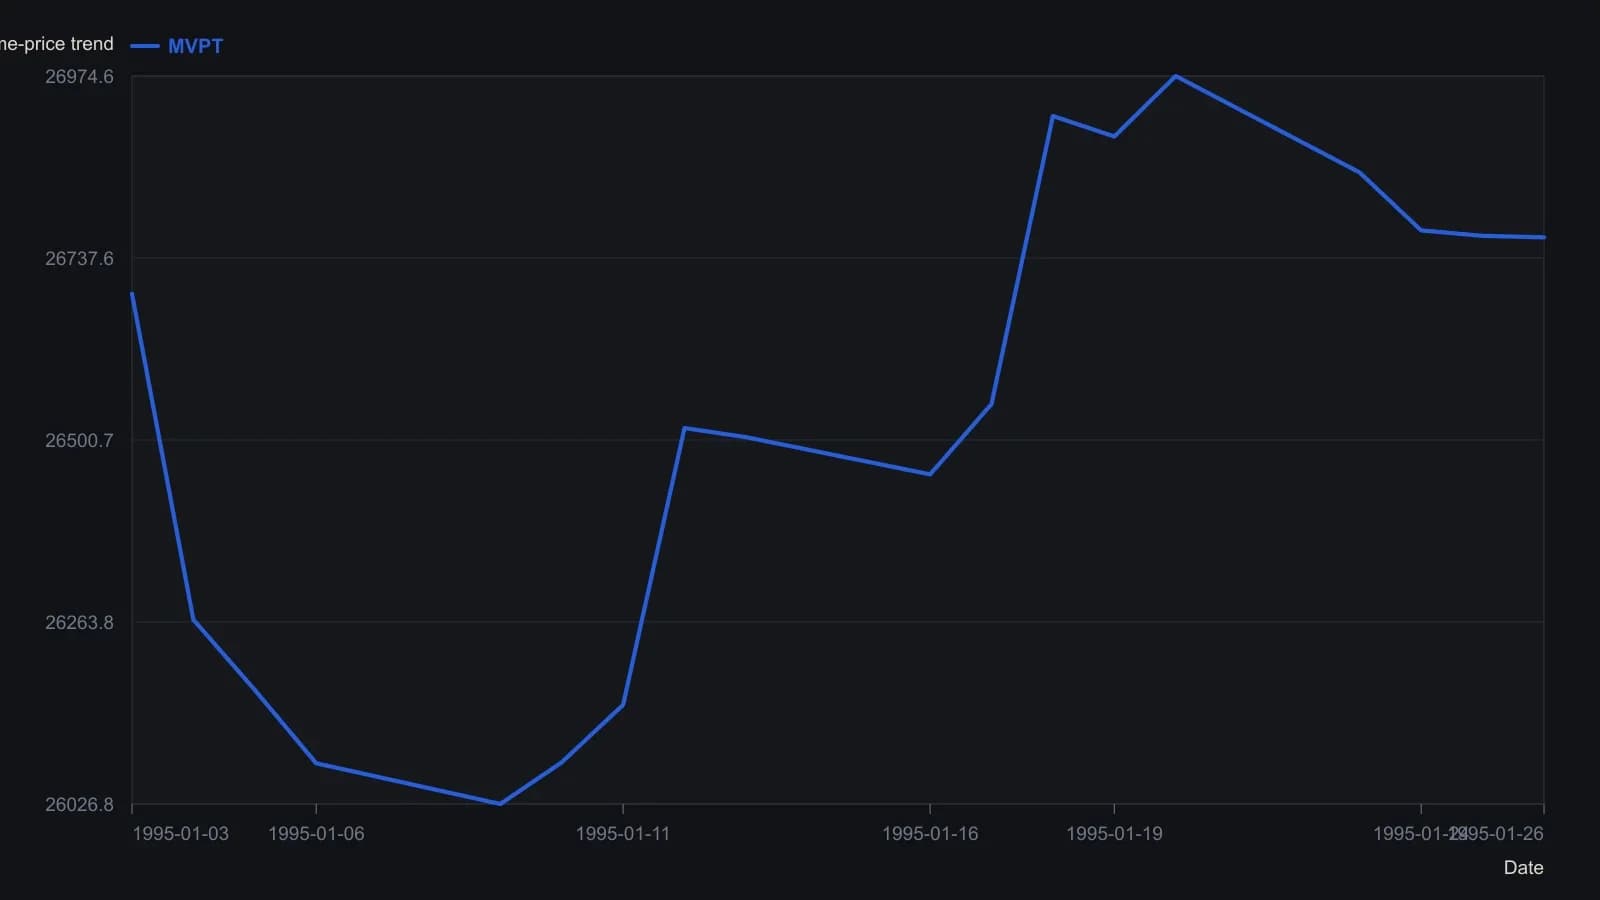
The worksheet primes MVPT at raw volume and does not divide by 50,000, unlike the TradeStation listing. Alignment to a log price scale is a later step: divide MVPT by its first value and raise 10 to that power (the ExpMVPT column).
Logarithmic price with a linear indicator overlay
Display construction pairs a logarithmic price scale with a linear indicator scale so the cumulative volume-price line can be compared with the shape of price rather than with raw price units. Level and scale inputs shift and stretch the plotted line so the indicator can be overlaid on price without changing the underlying cumulative calculation.
Confirmation and Price-indicator divergence
Agreement between the log-price path and the linear modified volume-price line is the intended visual test of confirmation. A split between those paths is the intended visual test of Price-indicator divergence.
A well-defined bar-by-bar recurrence
Spreadsheet and platform implementations keep a prior-bar state for the cumulative total and skip the increment when the previous average price is zero, so the recurrence is well-defined bar by bar.
All readings on this track · 61 readings
- 1988Cumulative volume trend and 200-session polarity
- 1988Three clocks when cumulative volume led price
- 1988Payoff index checkpoints for open interest and divergence
- 1988Relative strength, stochastics, and on-balance volume as a turning-point stack
- 1988Signing volume by open interest change
- 1988Case study: weekly on-balance volume with trendlines and a 21-period average
- 1988Combining weekly and daily MACD divergences with on-balance volume
- 1988Restoring the original tests for market breadth, on-balance volume, and trendlines
- 1989Evaluating volume-weighted breadth extremes
- 1989Demand oscillator construction with a momentum overlay
- 1989Constructing a volume percentage ratio from advance-decline flow
- 1990Constructing net positive volume as On-balance volume
- 1990Buying-share scale with on-balance volume
- 1990Friday-filtered on-balance confirmation lines
- 1991Constructing rate-market volume breadth from on-balance volume
- 1991Building a breadth composite from on-balance volume breakouts
- 1992Constructing a rate-complex volume-breadth index
- 1992Constructing a breadth index from on-balance volume
- 1992Constructing signed market thrust from issue volume
- 1992Constructing indicator phase across averages, volume and bands
- 1993Force on-balance volume to agree with itself at slower horizons
- 1993Three transforms of market thrust from breadth and volume
- 1994Constructing a tick-line momentum oscillator
- 1994Constructing a smoothed on-balance tick momentum oscillator
- 1994Histogram confirmation and a second-series veto for MACD-family alerts
- 1994Constructing a 40-period envelope on on-balance volume
- 1996Constructing a matched percent-B volume disparity
- 1997Constructing calendar regime overlays and volume-weighted rules
- 1997Constructing market thrust from breadth and volume
- 1997Constructing on-balance volume as a signed running total
- 1997A three-layer construction for a signed volume-force oscillator
- 1997Constructing a range-sum volume-force oscillator
- 1999On-balance volume confirmation, price-indicator divergence, and bounded exits
- 2000A daily long-only confirmation stack on the tether line
- 2000A three-filter tether and volume trend system
- 2003Constructing finite volume elements as a finite-period money-flow filter
- 2003Constructing on-balance volume from signed session volume
- 2003On-balance volume as a market-breadth participation ledger
- 2003Construct a volatility-adjusted on-balance volume filter before confirming a breakout
- 2004Opening and midday ranges as an on-balance-volume breakout case
- 2004Constructing a volatility-gated volume-flow measure
- 2004Constructing a volume-flow series from on-balance volume
- 2004Volume-flow indicator construction from on-balance volume
- 2004Volume-flow slope divergence, then separate on-balance-volume and crossover rules
- 2004Volume flow and band construction as one inspectable problem
- 2004Auditing advance-decline confirmation for scale, horizon, and composition
- 2005Bounded market breadth from the Arms index to BRIN
- 2006Overnight-hold entry and exit construction
- 2007Evaluating Volume-price confirmation versus On-balance volume and MACD
- 2009Volume confirmation versus a price advance
- 2010Typeahead retrieval of a moving average, on-balance volume, and a stochastic oscillator
- 2010Modified volume-price trend and log-price scale alignment
- 2010Constructing liquidity accelerometers from advance-decline averages
- 2012Failed short cycles as breadth and volume tests
- 2016Earnings straddles, implied volatility, and money-flow filters
- 2017A volume residual filter and a price projection matrix
- 2019Volume-volatility parabola and signed-volume momentum
- 2019Separating on-balance volume into breadth and volume
- 2020Constructing the obvm signal line
- 2020Constructing smoothed on-balance volume with a signal line
- 2020Keep neutrality as a first-class input in three-state market data