1996issue C061
Constructing a matched percent-B volume disparity
The close and on-balance volume are passed through the same 33-period moving average, the same two-standard-deviation envelope, and the same percent-B map before a one-shifted ratio is formed. Parameters from a weekly index application are flagged for review before reuse on daily individual-stock series.
- The close and on-balance volume each receive a 33-period moving average and a two-standard-deviation envelope before percent-B is computed.
- Volume disparity is one plus price percent-B, divided by one plus on-balance volume percent-B, so the two series share one scale and the denominator is not zero.
- Parameters from a weekly index application are flagged for review before reuse on daily individual-stock series, with a relative-strength line treated as an initial upward-trend filter.
- A negative-volume companion updates only when volume falls, and each finished indicator may be smoothed with a moving average and read alongside other technical indicators.
A shared-scale construction
Volume disparity compares the close with on-balance volume after both series have been mapped onto one scale. The construction applies the same lookback, the same two-deviation envelope, and the same percent-B map to each series, then forms a one-shifted ratio.
On-balance volume is the running volume total used as the second series. Bollinger Bands supply the envelope around a moving average. The moving average is an equal-weight average of the most recent lookback observations of a chosen series, used here as both a price centerline and an on-balance volume centerline.
Price centerline and bands
The price centerline is a 33-period moving average of the close. Upper and lower price bands sit two population standard deviations above and below that 33-period average.
Those bands are an envelope around the moving average, placed a stated number of standard deviations above and below that average.
On-balance volume and the matched envelope
On-balance volume begins at the first session volume, then adds volume on an up close, subtracts volume on a down close, and holds when the close is unchanged. It is a running volume total that adds the session volume on an up close, subtracts it on a down close, and holds the prior total when the close is unchanged.
The same 33-period average and two-standard-deviation envelope are then applied to the on-balance volume series.
Percent-B and the disparity ratio
Percent-B is the location of a value between its lower and upper bands, computed as the distance from the lower band divided by the full band width. For a series, percent-B equals that series minus its lower band, divided by the distance between its upper and lower bands.
The on-balance volume disparity reading is one plus price percent-B, divided by one plus on-balance volume percent-B, with the added one used to keep the denominator from being zero. Volume disparity is a ratio that compares shifted price percent-B with shifted on-balance volume percent-B so the two series are read on one scale.
JPM on-balance volume, January–February 1996
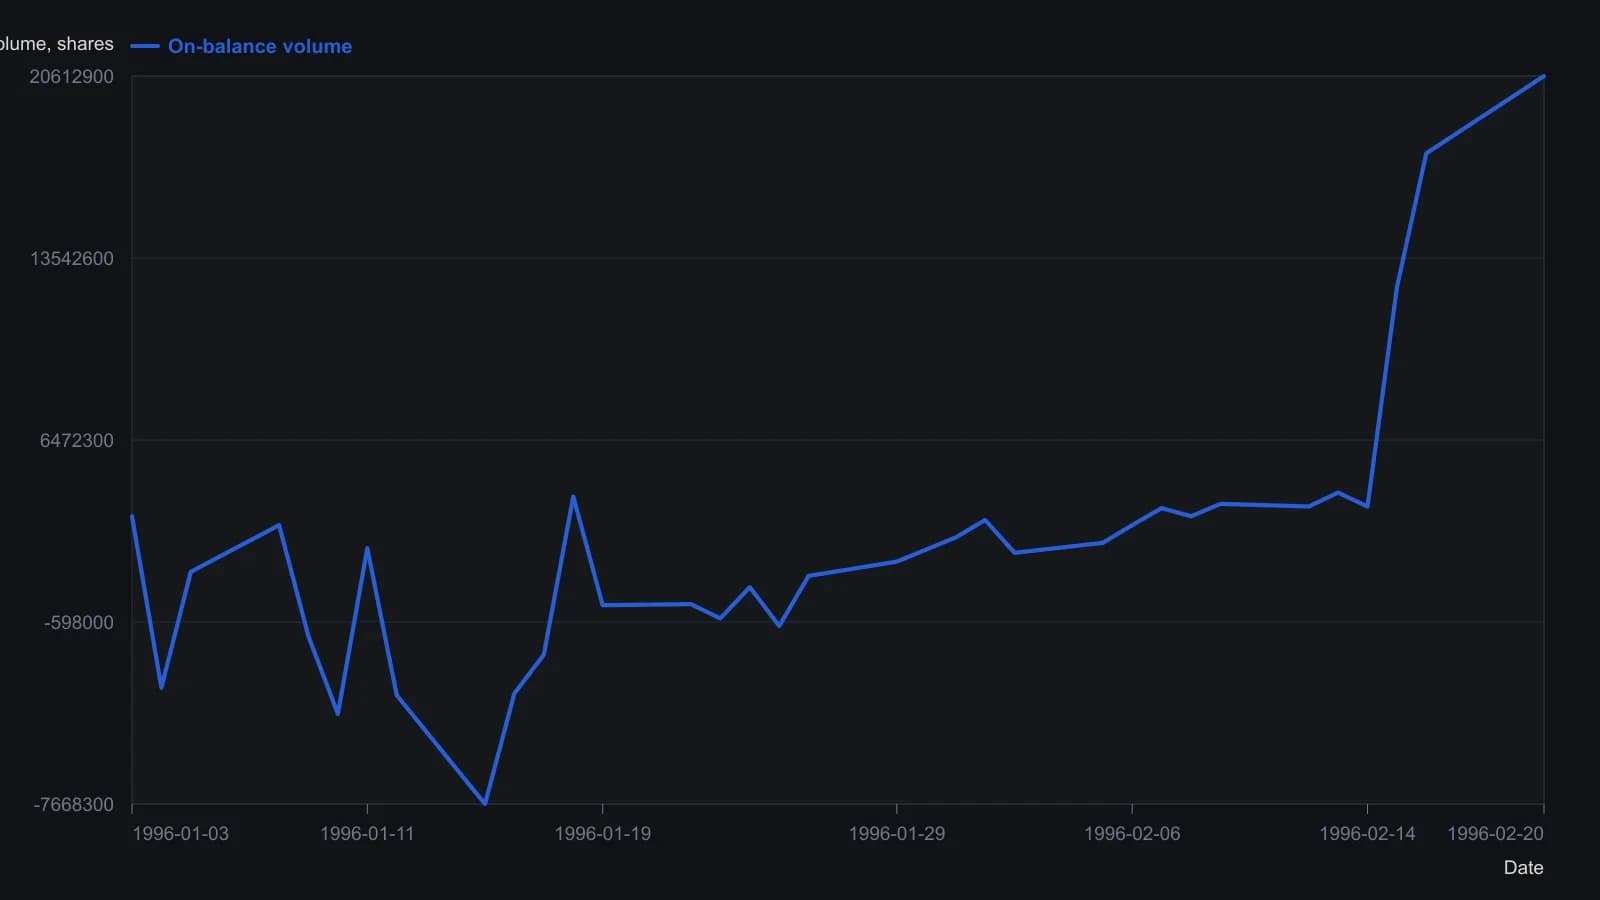
Column H is the raw on-balance volume: first cell equals that day’s volume; later cells add volume on an up close, subtract it on a down close, and hold on an unchanged close. The 33-period average, two-standard-deviation bands, percent-B, and disparity ratio only appear after the lookback fills, so those later columns are not plotted here.
Negative-volume companion
The negative-volume variant is initialized at 100 and, only when volume falls, adds 100 times the close-to-close percent change. Otherwise the running total is left unchanged.
Negative volume is a companion running series that updates only when volume declines, adding a scaled close-to-close percent change and otherwise leaving the prior value unchanged.
Review before reuse
Parameters taken from a weekly index application are flagged for review before reuse on daily individual-stock series, with a relative-strength line treated as an initial upward-trend filter.
After construction, each indicator may be smoothed with a moving average of the user's choosing and read alongside other technical indicators.
All readings on this track · 61 readings
- 1988Cumulative volume trend and 200-session polarity
- 1988Three clocks when cumulative volume led price
- 1988Payoff index checkpoints for open interest and divergence
- 1988Relative strength, stochastics, and on-balance volume as a turning-point stack
- 1988Signing volume by open interest change
- 1988Case study: weekly on-balance volume with trendlines and a 21-period average
- 1988Combining weekly and daily MACD divergences with on-balance volume
- 1988Restoring the original tests for market breadth, on-balance volume, and trendlines
- 1989Evaluating volume-weighted breadth extremes
- 1989Demand oscillator construction with a momentum overlay
- 1989Constructing a volume percentage ratio from advance-decline flow
- 1990Constructing net positive volume as On-balance volume
- 1990Buying-share scale with on-balance volume
- 1990Friday-filtered on-balance confirmation lines
- 1991Constructing rate-market volume breadth from on-balance volume
- 1991Building a breadth composite from on-balance volume breakouts
- 1992Constructing a rate-complex volume-breadth index
- 1992Constructing a breadth index from on-balance volume
- 1992Constructing signed market thrust from issue volume
- 1992Constructing indicator phase across averages, volume and bands
- 1993Force on-balance volume to agree with itself at slower horizons
- 1993Three transforms of market thrust from breadth and volume
- 1994Constructing a tick-line momentum oscillator
- 1994Constructing a smoothed on-balance tick momentum oscillator
- 1994Histogram confirmation and a second-series veto for MACD-family alerts
- 1994Constructing a 40-period envelope on on-balance volume
- 1996Constructing a matched percent-B volume disparity
- 1997Constructing calendar regime overlays and volume-weighted rules
- 1997Constructing market thrust from breadth and volume
- 1997Constructing on-balance volume as a signed running total
- 1997A three-layer construction for a signed volume-force oscillator
- 1997Constructing a range-sum volume-force oscillator
- 1999On-balance volume confirmation, price-indicator divergence, and bounded exits
- 2000A daily long-only confirmation stack on the tether line
- 2000A three-filter tether and volume trend system
- 2003Constructing finite volume elements as a finite-period money-flow filter
- 2003Constructing on-balance volume from signed session volume
- 2003On-balance volume as a market-breadth participation ledger
- 2003Construct a volatility-adjusted on-balance volume filter before confirming a breakout
- 2004Opening and midday ranges as an on-balance-volume breakout case
- 2004Constructing a volatility-gated volume-flow measure
- 2004Constructing a volume-flow series from on-balance volume
- 2004Volume-flow indicator construction from on-balance volume
- 2004Volume-flow slope divergence, then separate on-balance-volume and crossover rules
- 2004Volume flow and band construction as one inspectable problem
- 2004Auditing advance-decline confirmation for scale, horizon, and composition
- 2005Bounded market breadth from the Arms index to BRIN
- 2006Overnight-hold entry and exit construction
- 2007Evaluating Volume-price confirmation versus On-balance volume and MACD
- 2009Volume confirmation versus a price advance
- 2010Typeahead retrieval of a moving average, on-balance volume, and a stochastic oscillator
- 2010Modified volume-price trend and log-price scale alignment
- 2010Constructing liquidity accelerometers from advance-decline averages
- 2012Failed short cycles as breadth and volume tests
- 2016Earnings straddles, implied volatility, and money-flow filters
- 2017A volume residual filter and a price projection matrix
- 2019Volume-volatility parabola and signed-volume momentum
- 2019Separating on-balance volume into breadth and volume
- 2020Constructing the obvm signal line
- 2020Constructing smoothed on-balance volume with a signal line
- 2020Keep neutrality as a first-class input in three-state market data