2012issue C0746-51
Failed short cycles as breadth and volume tests
If a practiced method expects a move and the market refuses it, the refusal can indicate a larger underlying trend rather than a broken method. This case treats a bounce that cannot print as a failed short-horizon window, then checks market breadth, volume-price agreement, and money flow against the next larger cycle.
- If a practiced method expects a move and the market refuses it, the refusal can indicate a larger underlying trend rather than a broken method.
- When a two-to-10-day buy window could not produce even two days of advance, that failed bounce was treated as evidence that a longer-term force was pressing the market lower.
- The 2008 tape was characterized as lacking normal rallies, and the 2009 tape as lacking normal pullbacks, each read as an unusually one-sided underlying trend.
- A money-flow reading on a major average can drop sharply while price is still being marked up, a volume-price divergence in the same confirmation family as on-balance volume.
When the short cycle cannot complete
If a practiced method expects a move and the market refuses it, the refusal can indicate a larger underlying trend rather than a broken method. The archive treats that refusal as a failed-cycle-signal: a short-horizon buy or sell window that cannot produce the move the window implies, used as evidence about the next larger cycle.
One case framework splits market rhythm into two-to-10-day, two-to-10-week, and two-to-10-month windows so a failed short-horizon signal can be tested against a bigger cycle. When a two-to-10-day buy window could not produce even two days of advance, that failed bounce was treated as evidence that a longer-term force was pressing the market lower.
About 90 percent of the usable information in a market can be gathered in roughly the first 10 percent of study time, with the remaining 10 percent taking the remaining 90 percent of the time.
Microsoft daily closes, May–November 2011
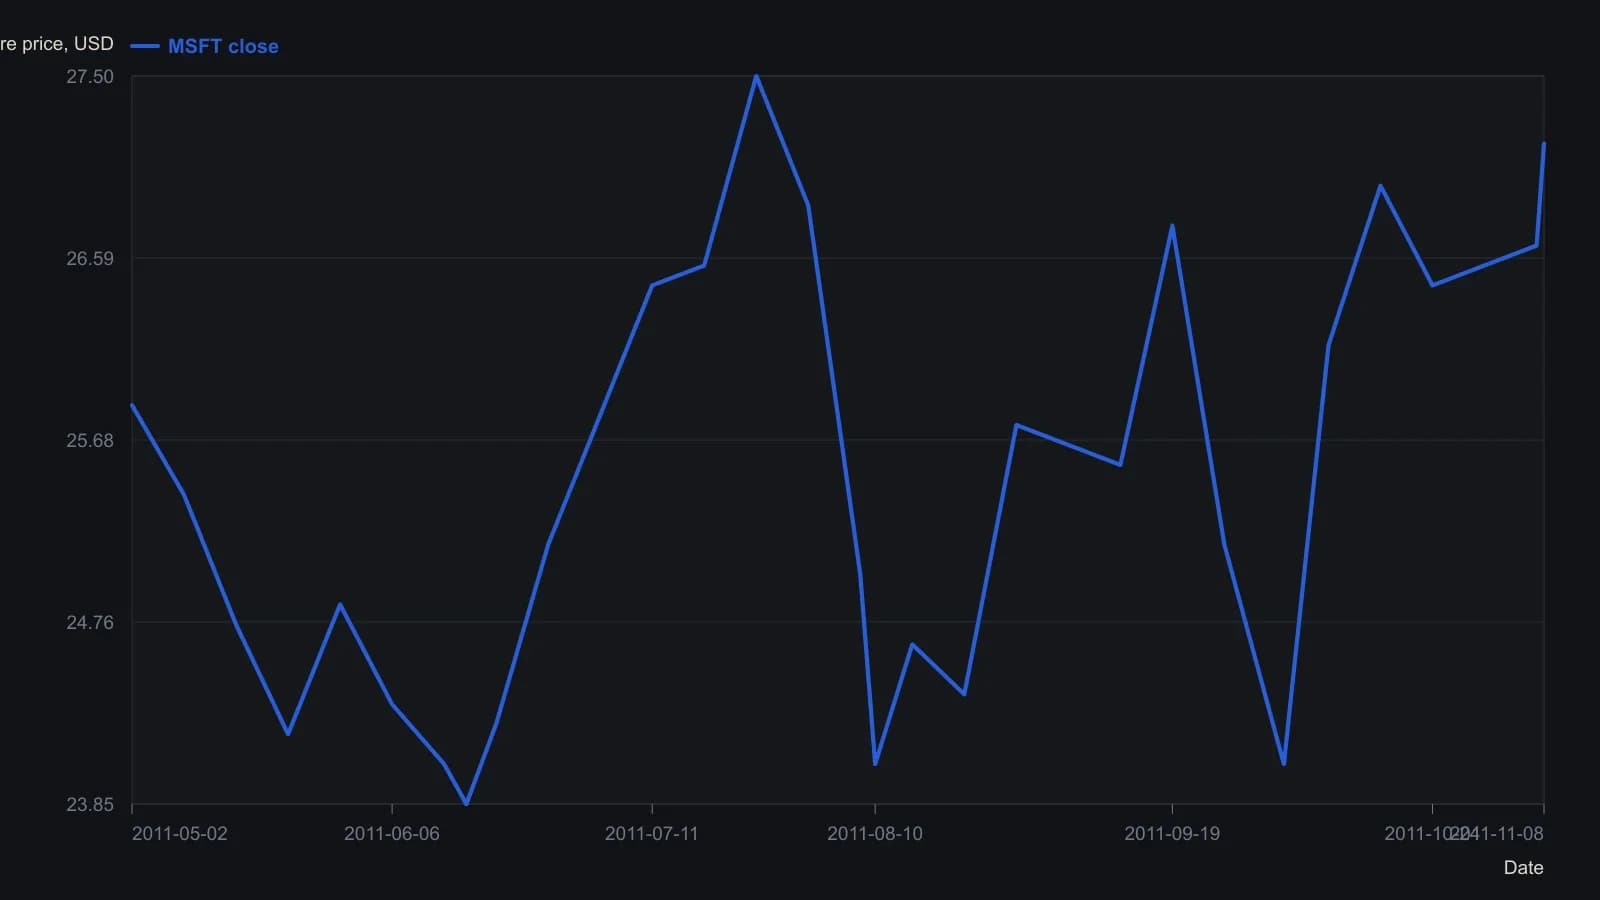
All but the 8 November close are digitized from the raster, so they are approximate to about a tenth of a dollar. The last close, 27.16, is the value printed on the chart. The S&P 500 overlay on the same print uses a second scale and is not converted onto this axis.
Two tapes, one underlying trend
The 2008 tape was characterized as lacking normal rallies, read as an unusually weak underlying trend. The 2009 tape was characterized as lacking normal pullbacks, read as an unusually strong underlying trend.
Underlying trend, in this usage, is the longer-horizon force inferred when a shorter cycle cannot complete its expected rally or reaction. Interest-rate and credit-cycle position supplies the longer-term headwind or tailwind against which short-horizon breadth and volume signals are interpreted.
Market breadth as the participation check
A broad decline is framed as a market-breadth sequence: a few stocks top first, then more names join, until the averages and nearly all issues fall together. Market breadth is how widely an advance or decline is shared, from a few names topping or leading to the averages and most issues moving together.
Editorial reading: if the short-horizon bounce cannot start, check whether participation is already aligning with the larger decline rather than with a rebound.
Volume-price analysis and on-balance volume
Volume-price analysis is reading whether volume expands, dries up, or reverses in line with the price structure on the chart being tested. On-balance volume is a running total of volume added on up periods and subtracted on down periods, used to check whether money flow confirms or diverges from price.
A money-flow reading on a major average can drop sharply while price is still being marked up, a volume-price divergence in the same confirmation family as on-balance volume.
Closes, rebalancing, and turning-point sentiment
Late-session volume and money-flow readings in the last 10 minutes can reflect exchange-traded fund rebalancing rather than a fresh directional thesis. Late-session money flow is volume and allocation activity concentrated near the close, including fund and exchange-traded product rebalancing.
Crowd sentiment is described as typically enthusiastic near peaks and pessimistic near troughs, so turning-point decisions often run against prevailing headlines. That pattern is turning-point sentiment: enthusiasm clusters near peaks and pessimism near troughs, so decisive turns often oppose the prevailing headline.
All readings on this track · 61 readings
- 1988Cumulative volume trend and 200-session polarity
- 1988Three clocks when cumulative volume led price
- 1988Payoff index checkpoints for open interest and divergence
- 1988Relative strength, stochastics, and on-balance volume as a turning-point stack
- 1988Signing volume by open interest change
- 1988Case study: weekly on-balance volume with trendlines and a 21-period average
- 1988Combining weekly and daily MACD divergences with on-balance volume
- 1988Restoring the original tests for market breadth, on-balance volume, and trendlines
- 1989Evaluating volume-weighted breadth extremes
- 1989Demand oscillator construction with a momentum overlay
- 1989Constructing a volume percentage ratio from advance-decline flow
- 1990Constructing net positive volume as On-balance volume
- 1990Buying-share scale with on-balance volume
- 1990Friday-filtered on-balance confirmation lines
- 1991Constructing rate-market volume breadth from on-balance volume
- 1991Building a breadth composite from on-balance volume breakouts
- 1992Constructing a rate-complex volume-breadth index
- 1992Constructing a breadth index from on-balance volume
- 1992Constructing signed market thrust from issue volume
- 1992Constructing indicator phase across averages, volume and bands
- 1993Force on-balance volume to agree with itself at slower horizons
- 1993Three transforms of market thrust from breadth and volume
- 1994Constructing a tick-line momentum oscillator
- 1994Constructing a smoothed on-balance tick momentum oscillator
- 1994Histogram confirmation and a second-series veto for MACD-family alerts
- 1994Constructing a 40-period envelope on on-balance volume
- 1996Constructing a matched percent-B volume disparity
- 1997Constructing calendar regime overlays and volume-weighted rules
- 1997Constructing market thrust from breadth and volume
- 1997Constructing on-balance volume as a signed running total
- 1997A three-layer construction for a signed volume-force oscillator
- 1997Constructing a range-sum volume-force oscillator
- 1999On-balance volume confirmation, price-indicator divergence, and bounded exits
- 2000A daily long-only confirmation stack on the tether line
- 2000A three-filter tether and volume trend system
- 2003Constructing finite volume elements as a finite-period money-flow filter
- 2003Constructing on-balance volume from signed session volume
- 2003On-balance volume as a market-breadth participation ledger
- 2003Construct a volatility-adjusted on-balance volume filter before confirming a breakout
- 2004Opening and midday ranges as an on-balance-volume breakout case
- 2004Constructing a volatility-gated volume-flow measure
- 2004Constructing a volume-flow series from on-balance volume
- 2004Volume-flow indicator construction from on-balance volume
- 2004Volume-flow slope divergence, then separate on-balance-volume and crossover rules
- 2004Volume flow and band construction as one inspectable problem
- 2004Auditing advance-decline confirmation for scale, horizon, and composition
- 2005Bounded market breadth from the Arms index to BRIN
- 2006Overnight-hold entry and exit construction
- 2007Evaluating Volume-price confirmation versus On-balance volume and MACD
- 2009Volume confirmation versus a price advance
- 2010Typeahead retrieval of a moving average, on-balance volume, and a stochastic oscillator
- 2010Modified volume-price trend and log-price scale alignment
- 2010Constructing liquidity accelerometers from advance-decline averages
- 2012Failed short cycles as breadth and volume tests
- 2016Earnings straddles, implied volatility, and money-flow filters
- 2017A volume residual filter and a price projection matrix
- 2019Volume-volatility parabola and signed-volume momentum
- 2019Separating on-balance volume into breadth and volume
- 2020Constructing the obvm signal line
- 2020Constructing smoothed on-balance volume with a signal line
- 2020Keep neutrality as a first-class input in three-state market data