1991issue C041-8
Constructing rate-market volume breadth from on-balance volume
A construction for rate-market volume breadth: weight several rate-sensitive series into one composite, convert each to on-balance volume, and collapse labeled breakouts into a signed tally that can confirm or diverge from the price composite.
- This construction uses two recorded series, price and volume, and treats open interest as outstanding potential volume rather than a third independent input.
- Each constituent is converted to on-balance volume; a bullish breakout votes +1 and a bearish breakdown votes -1, so the signed breadth tally is bounded from +8 to -8.
- A new price high or low unmatched by the volume trend or signed tally is a non-confirmation that warrants caution.
- Only two consecutive higher highs separated by two higher lows, or two consecutive lower lows separated by two lower highs, count as complete volume clusters; every other sequence is still developing.
Build the object first
Market breadth is treated here as a built object, not a chart impression. The historical workflow weights several rate-sensitive markets into a financial volume composite, converts each series to on-balance volume, and collapses labeled breakouts into one signed breadth tally.
Editorial reading: once those steps are fixed, confirmation and divergence are states a reader can audit against the same construction, rather than a visual impression of a single price plot.
Price and volume as the recorded inputs
In this construction, supply-and-demand work uses two recorded series, price and volume. Open interest is treated as outstanding potential volume rather than a third independent input.
Apply volume-price analysis as you would price
Volume-price analysis means reading volume patterns, labeled breakouts, and non-confirmations against the same market's price extremes. It is applied the same way as price work: rising volume bottoms or falling volume tops are compared with price, and breakouts or breakdowns can be labeled into a running total.
A new price high or low that is not matched by the volume trend is treated as a non-confirmation that warrants caution. Divergence is that split: price records a new high or low while the volume trend or signed tally fails to confirm that extreme.
Complete clusters versus a developing cluster
The most bullish volume cluster is two consecutive higher-high readings separated by two higher lows. The most bearish cluster is two consecutive lower lows separated by two lower highs. A developing cluster is any volume high-low sequence that is not yet two consecutive confirming extremes separated by two opposite-side pullbacks; any other sequence is classified as still developing.
Weights in the financial volume composite
The financial volume composite is a weighted mix of rate-sensitive cash and futures series constructed so the same index can carry both price and volume. It is built so one index carries price, volume, and mixed rate-sensitive instruments, allowing yield-curve and credit-perception readings that a single cash or futures series cannot provide.
Specified weights are 50% of a utility equity index, 100% of a 20-bond cash index, 200% each on the front two-contract average of Treasury bond and 10-year note futures, and 100% each on five-year note, Treasury bill, Eurodollar, and municipal futures.
On-balance volume on each constituent
On-balance volume is a running total that adds a session's volume after an up close and subtracts it after a down close, then is plotted for trend comparison. It is computed per constituent by adding that session's volume after an up close and subtracting it after a down close. Higher highs and higher lows in the plotted series confirm a trend, while lower highs and lower lows negate it.
Collapse breakouts into a signed breadth tally
The signed breadth tally is the daily sum of constituent breakout votes, plus one for a bullish breakout and minus one for a bearish breakdown. The published volume index sums each constituent's signed on-balance-volume breakout state, producing a score bounded from +8 to -8, and is charted against the price composite.
1987 Financial Volume Index
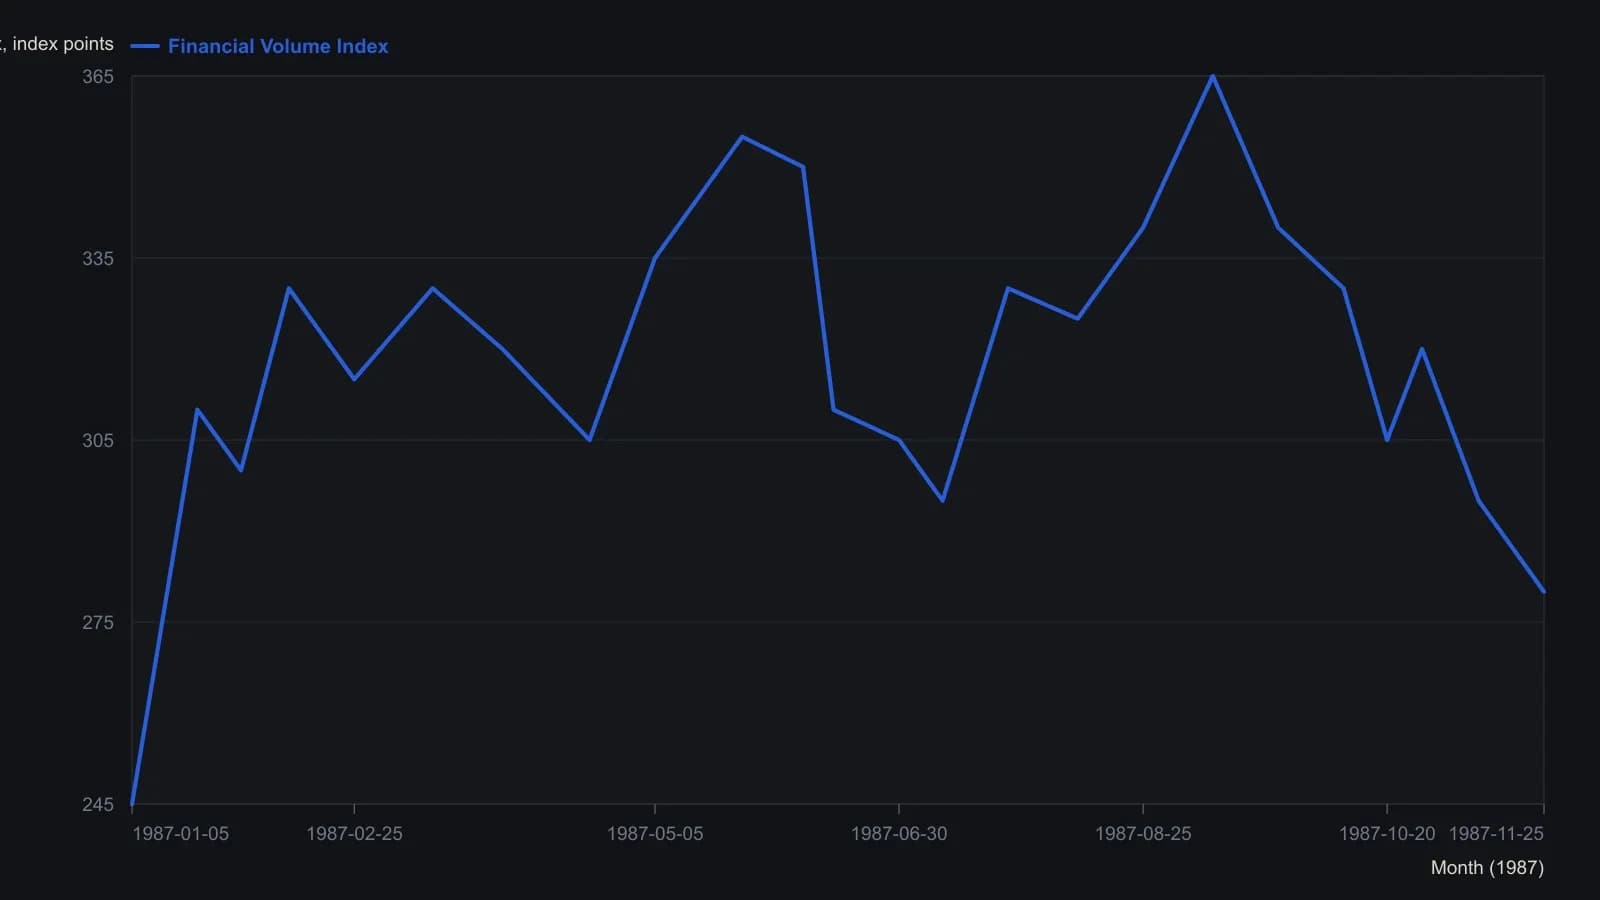
Magazine raster of daily or weekly bars. Closes are approximate to the nearest five index points; intra-bar wicks were not treated as the series.
Divergence as a tally that fails to follow price
Worked examples record divergence as a volume-tally turn or hold that does not match the price composite. They include a December 1987 volume upturn from -3 while price was still correcting about 5%, a 1989 hold at -4 while price kept falling, and a 1990 stop at -3 on new price lows.
A fast return after an August collapse
After an August collapse in the price composite, the volume tally is described as returning quickly to its pre-selloff level, which was read as a condition that price should at least re-enter the prior summer channel.
All readings on this track · 61 readings
- 1988Cumulative volume trend and 200-session polarity
- 1988Three clocks when cumulative volume led price
- 1988Payoff index checkpoints for open interest and divergence
- 1988Relative strength, stochastics, and on-balance volume as a turning-point stack
- 1988Signing volume by open interest change
- 1988Case study: weekly on-balance volume with trendlines and a 21-period average
- 1988Combining weekly and daily MACD divergences with on-balance volume
- 1988Restoring the original tests for market breadth, on-balance volume, and trendlines
- 1989Evaluating volume-weighted breadth extremes
- 1989Demand oscillator construction with a momentum overlay
- 1989Constructing a volume percentage ratio from advance-decline flow
- 1990Constructing net positive volume as On-balance volume
- 1990Buying-share scale with on-balance volume
- 1990Friday-filtered on-balance confirmation lines
- 1991Constructing rate-market volume breadth from on-balance volume
- 1991Building a breadth composite from on-balance volume breakouts
- 1992Constructing a rate-complex volume-breadth index
- 1992Constructing a breadth index from on-balance volume
- 1992Constructing signed market thrust from issue volume
- 1992Constructing indicator phase across averages, volume and bands
- 1993Force on-balance volume to agree with itself at slower horizons
- 1993Three transforms of market thrust from breadth and volume
- 1994Constructing a tick-line momentum oscillator
- 1994Constructing a smoothed on-balance tick momentum oscillator
- 1994Histogram confirmation and a second-series veto for MACD-family alerts
- 1994Constructing a 40-period envelope on on-balance volume
- 1996Constructing a matched percent-B volume disparity
- 1997Constructing calendar regime overlays and volume-weighted rules
- 1997Constructing market thrust from breadth and volume
- 1997Constructing on-balance volume as a signed running total
- 1997A three-layer construction for a signed volume-force oscillator
- 1997Constructing a range-sum volume-force oscillator
- 1999On-balance volume confirmation, price-indicator divergence, and bounded exits
- 2000A daily long-only confirmation stack on the tether line
- 2000A three-filter tether and volume trend system
- 2003Constructing finite volume elements as a finite-period money-flow filter
- 2003Constructing on-balance volume from signed session volume
- 2003On-balance volume as a market-breadth participation ledger
- 2003Construct a volatility-adjusted on-balance volume filter before confirming a breakout
- 2004Opening and midday ranges as an on-balance-volume breakout case
- 2004Constructing a volatility-gated volume-flow measure
- 2004Constructing a volume-flow series from on-balance volume
- 2004Volume-flow indicator construction from on-balance volume
- 2004Volume-flow slope divergence, then separate on-balance-volume and crossover rules
- 2004Volume flow and band construction as one inspectable problem
- 2004Auditing advance-decline confirmation for scale, horizon, and composition
- 2005Bounded market breadth from the Arms index to BRIN
- 2006Overnight-hold entry and exit construction
- 2007Evaluating Volume-price confirmation versus On-balance volume and MACD
- 2009Volume confirmation versus a price advance
- 2010Typeahead retrieval of a moving average, on-balance volume, and a stochastic oscillator
- 2010Modified volume-price trend and log-price scale alignment
- 2010Constructing liquidity accelerometers from advance-decline averages
- 2012Failed short cycles as breadth and volume tests
- 2016Earnings straddles, implied volatility, and money-flow filters
- 2017A volume residual filter and a price projection matrix
- 2019Volume-volatility parabola and signed-volume momentum
- 2019Separating on-balance volume into breadth and volume
- 2020Constructing the obvm signal line
- 2020Constructing smoothed on-balance volume with a signal line
- 2020Keep neutrality as a first-class input in three-state market data