2011issue C0732-37
Linear regression overlays on volume-flow primaries
This editorial teaches a two-layer chart: keep the accumulation and distribution line or on-balance volume as the unfinished primary indicator, then park a linear-regression subindicator on that series so slope, crossover, and an exhaustion pattern can be read while the candles still look quiet.
- Market-data indicators split into primary indicators that formulaically smooth price, time, and volume, and subindicators applied to those series to form a derivative comparison.
- The accumulation and distribution line and on-balance volume are volume-flow primaries. Volume-and-time primaries may be period-based or cumulative, and a subindicator is especially useful on a single-line primary.
- A moving linear-regression subindicator on a single-line primary can reveal a steeper internal slope and a crossover even when the price bars still look quiet.
- Pairing a flow-of-funds primary with linear-regression subordinates can show funds entering during a sideways platform, a shift from downward to upward action inside a bottom, or money-flow diverging from rising price.
Primaries and subindicators
Market-data indicators split into two layers. A primary indicator is a formula that smooths price, time, and volume into a standalone series. A subindicator is a derivative overlay applied to that primary series rather than to raw market data, so the comparison is made against the finished primary line.
Named primary families include trend, quality, accumulation/distribution, oscillators, flow of funds, velocity and momentum, hybrid, and cycle. The accumulation and distribution line is a volume-flow primary that tracks whether trade is absorbing or distributing. On-balance volume is a cumulative volume-flow primary that adds or subtracts volume with the close.
Volume-and-time primaries may be period-based or cumulative. Subindicators are especially useful on histogram and single-line primaries.
What the overlay can surface
Linear regression is a fitted line or a moving-regression baseline used as a subordinate on another indicator. A subordinate can surface convergence, divergence, crossovers, slope, overextension, averaging, trough-peak structure, pre-turn extremes, improving action in a range, and exhaustion versus the primary. An exhaustion pattern is an extreme subordinate reading that precedes a long-horizon high or low.
A moving linear-regression subordinate on a single-line primary can reveal a steeper internal slope and a crossover even when the price bars still look quiet. Convergence between a primary series and a moving linear-regression subordinate can form before a sudden move, after which the two may cross and then diverge as price accelerates.
Straight linear-regression subordinates can be applied to any primary line, including a flow-of-funds series. Short-horizon and long-horizon slopes, their intersection, and which line sits above the other then become visible without hand-drawn trendlines.
Cubist RSI (14) with a 20-period moving linear regression
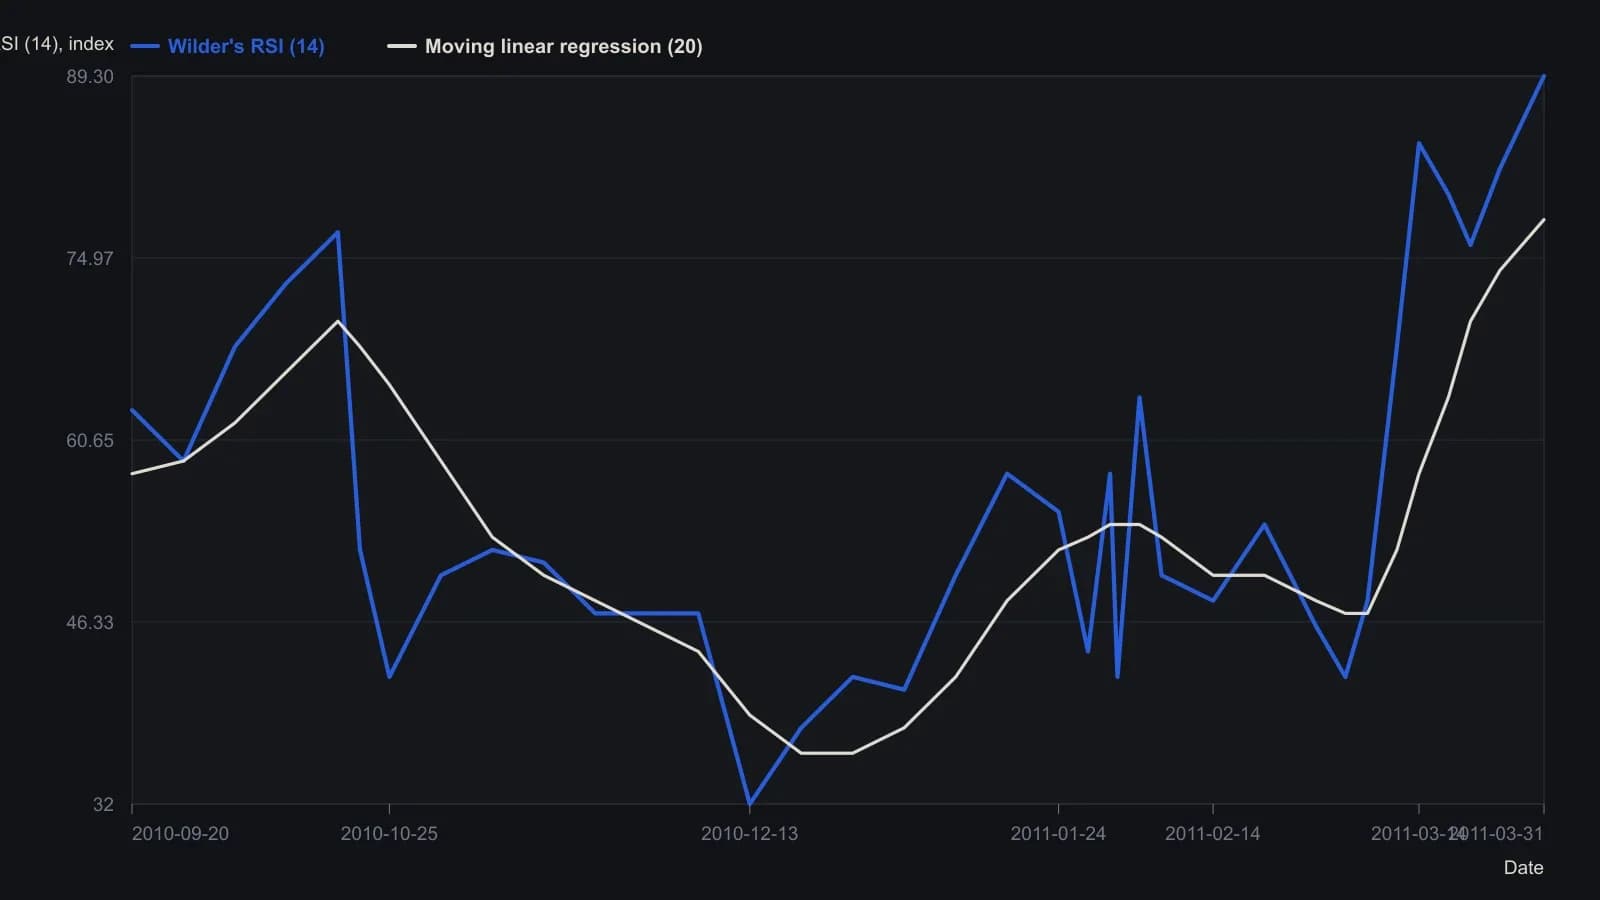
Pane settings are those printed on the chart: Wilder's RSI 14 and moving linear regression 20, daily bars for CBST from 20 September 2010 to 31 March 2011. Points are weekly axis labels plus visible turning bars only, so intraweek swings are not fully resolved. Values are approximate to the nearest oscillator point except the closing 89.3, which is printed.
Flow-of-funds pairings and placement
Pairing a flow-of-funds primary with linear-regression subordinates can show funds entering during a sideways platform, a shift from downward to upward action inside a bottom, or money-flow diverging from rising price.
Which subordinate to apply depends on trading style, the prevailing market condition, and the matching primary. Listed subordinates include simple and exponential averages, linear-regression lines, a moving linear-regression line, channels and bands, rate of change, and a time-series forecast.
Subindicators are applied directly to the primary in the same window. They can be used on stocks, major indexes, industry indexes, and exchange-traded funds, and they are most effective with one primary per window.
All readings on this track · 8 readings
- 1995Constructing an accumulative swing index from open-high-low-close comparisons
- 2001Confirming a price-box break with on-balance volume and the accumulation-distribution line
- 2004Why on-balance volume and the accumulation-distribution line disagree
- 2006Lagged commercial nets and a weekly accumulation trigger
- 2007Constructing dominant cycles from participant accumulation
- 2011Linear regression overlays on volume-flow primaries
- 2014Lookalike money flow is not on-balance volume
- 2015Volume-free accumulation and a next-session bias overlay