1996issue C041-5
A price-channel case study with a pending triangle signal and a planned stop-loss
A historical case study of a price channel that framed one lower-boundary purchase and one upper-boundary exit. A symmetrical triangle on the channel boundary was held until an upper pierce, and a stop-loss was planned before the first fill.
- A price channel marked trend boundaries so a lower-boundary purchase and an upper-boundary exit could be treated as one cross of the channel.
- A symmetrical triangle on the channel boundary was held as a pending signal. The trader waited for an upper-boundary pierce instead of calling the breakout direction in advance.
- The stop-loss was planned 12 percent below a 9 1/8 purchase and offset from a whole-number price, because clustered stops can become market orders.
- Channel boundaries were treated as oversold or overbought zones that prices do not linger on, so the teaching rule was to exit as price neared the far boundary.
The price-channel hypothesis
A price channel is used to mark trend boundaries so a lower-boundary purchase and an upper-boundary exit can be framed as one cross of the channel.
A triangle on the channel boundary
A symmetrical triangle is defined by successively lower highs and higher lows that coil toward an apex. Volume typically diminishes as the apex approaches.
In well-formed symmetrical triangles, a breakout is described as more reliable when it occurs about half to three-quarters of the way to the apex. The same breakout is described as weaker if price travels closer to the apex first.
A triangle sitting on a price-channel boundary was treated as a possible reversal. The trader waited for an upper-boundary pierce rather than predicting breakout direction in advance.
A stop-loss before the first fill
A stop-loss was planned 12 percent below a 9 1/8 purchase. The order was offset from a whole-number price because clustered stops can become market orders.
Varco (VRC) daily price and statistically positioned trend channel, 1995
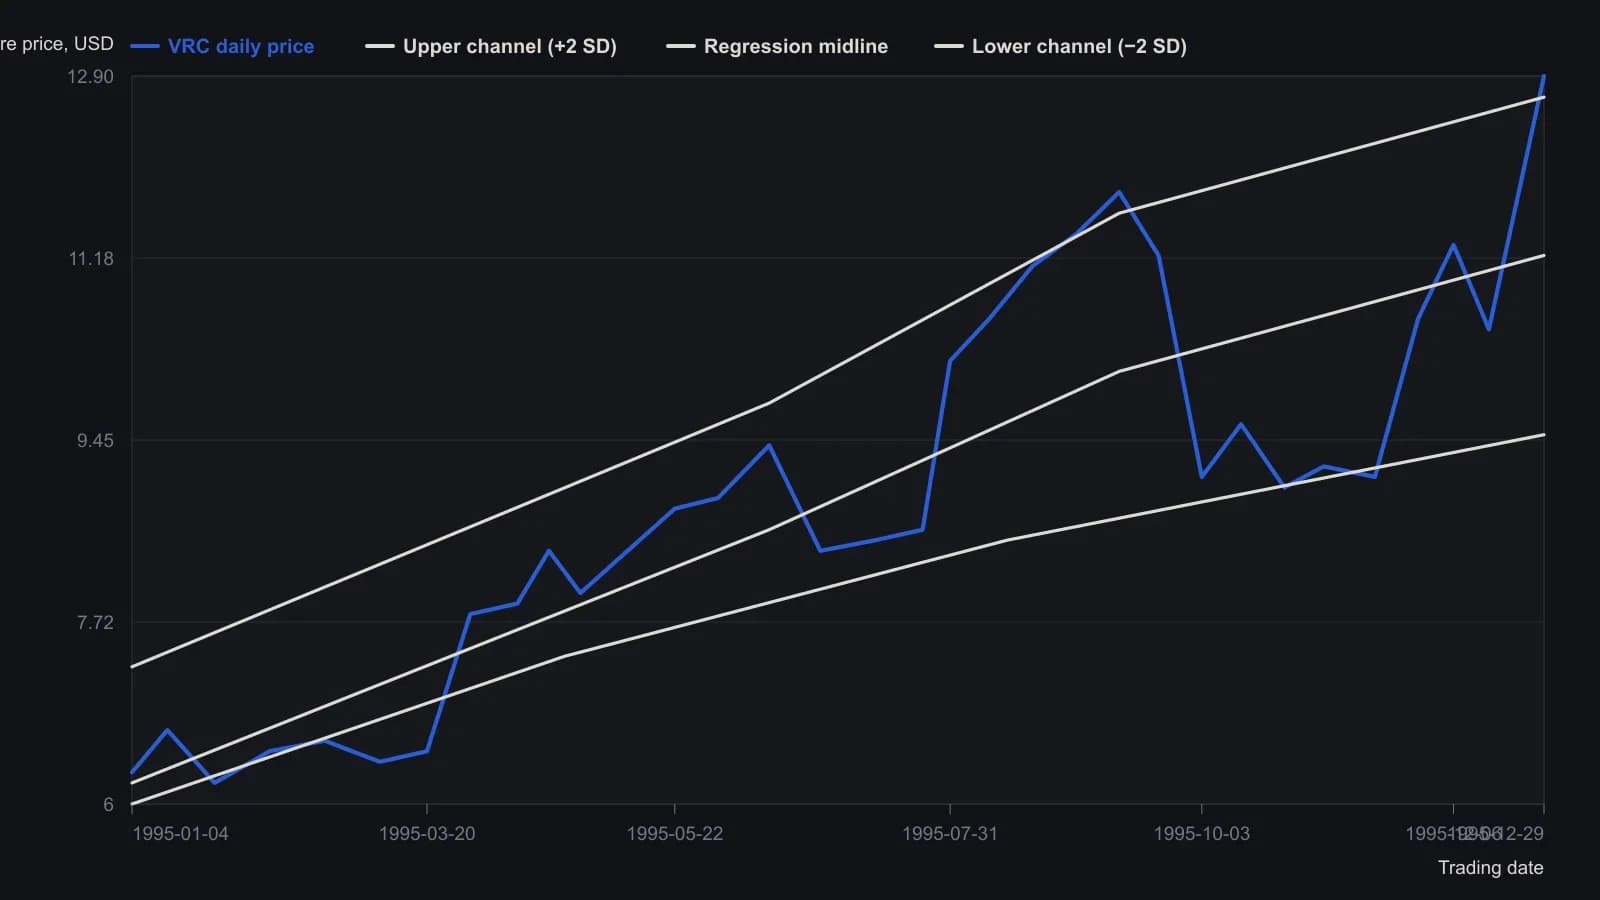
Bulkowski draws the midline as a least-squares fit to price and places the outer rails two standard deviations away. The small October–November coil sits on the lower rail. Values come from the raster, not from a printed table.
After entry, the far boundary is the exit
After entry, an advance was turned back at prior channel resistance just above the center channel line. Price later approached the upper channel boundary before the position was closed.
Channel boundaries are treated as oversold or overbought zones that prices do not linger on. The teaching rule is to exit when price nears the far boundary rather than wait for a higher print.
All readings on this track · 33 readings
- 1986Gold as a double zigzag before a contracting B-wave triangle
- 1990Scoring competing wave counts after a crash
- 1992Pre-trade checklist for trendline and triangle signals
- 1995Chart patterns as tactics, not strategy
- 1996Constructing Elliott wave counts with triangles and Fibonacci
- 1996A price-channel case study with a pending triangle signal and a planned stop-loss
- 1996Expanding triangle as a dual-label fourth-wave reversal worksheet
- 1997Rising wedge construction, breakout, and volume
- 1997Confirm structure and conditions before naming a Triangle pattern
- 1999Drawing the Triangle pattern before Breakout confirmation and the Stop-loss order
- 2000Four-phase market cycle triangle breakouts
- 2000Continuation triangles as a three-lock experiment
- 2001Folding rule: stacking three trendlines on an accelerating swing
- 2003A scored symmetrical triangle on a utility stock
- 2003Constructing wedges versus flat-boundary triangles
- 2004Testing triangle breakouts against volume filters
- 2004Mute triangles, histogram force, and trader optimization
- 2004Constructing falsifiable reversal and continuation patterns
- 2004Construct a corrective rising wedge before treating it as a short
- 2004A continuation triangle with Fibonacci targets and an apex stop
- 2005Pre-breakout filters for classic chart patterns
- 2005Reverse trendlines as a geometry lab for convergence and expanding triangles
- 2005Volume shapes versus triangle and double-pattern breakouts
- 2005A nested-pattern checklist on the 2005 euro
- 2005Volume test for a descending triangle breakout
- 2010Constructing triangle, broadening, and head and shoulders patterns
- 2011Treat a numeric pattern rank as a shortlist
- 2011Evaluating the head-and-shoulders as a falsifiable reversal
- 2013Auditing chart patterns by the first post-breakout swing
- 2014A three-gate entry for a triangle pullback
- 2014Golden triangle: a 50-day pause that still needs both gates
- 2014The triangle qualifier came after the rating pre-screen and the fifty-day bounce
- 2018Aligning daily, weekly, and monthly triangles with trendlines and Fibonacci retracements