2004issue C111-4
Candle diagnosis needs Western targets and stops
A small real-body or a doji can warn that a prior trend is losing force. The archive treats that candle as a timing diagnostic, not a finished idea. The reading is complete only when a Western head-and-shoulders-top supplies an approximate measured objective and a neckline that later marks the hypothesis wrong.
- Small real-bodies and doji sessions are read as stalemate and fading force, even when closes are still rising.
- Candlestick patterns time and diagnose reversals; they do not project how far price will travel.
- A head-and-shoulders-top overlay supplies an approximate measured objective and a neckline that becomes resistance after the break.
- A close back above that neckline is the stop-loss that marks the idea wrong; a hammer near the objective can confirm, while a risk-reward check and the larger trend still belong in the workflow.
The real-body scores the session
A candlestick real-body is treated as the core of the session because its height and color show which side, buyers or sellers, is winning.
Small real-bodies, light or dark, are read as a stalemate and as a warning that the prior trend may be losing force even if closes are still rising.
A doji forms when the open and close match and is treated as a balanced session. It is ignored as a reversal when it sits inside a box-range with no prior rally to unwind.
A candle is a diagnostic, not a system
A candlestick signal is presented as a tool, not a self-contained system. It is interpreted only against the surrounding technical picture, including whether price is trending or held in a box-range.
Candlestick patterns are described as timing and reversal diagnostics. They are explicitly said not to project how far price will travel.
Western structure supplies the objective
Because candles are built from the same open, high, low, and close as a bar chart, Western constructs such as trendlines, prior highs and lows, retracements, and measured moves can be overlaid to obtain price objectives.
A head-and-shoulders-top is three successive rally peaks with the middle peak highest. The Japanese analog is a three-Buddha temple silhouette. After the neckline through the flanking lows breaks, that line is treated as resistance, and a close back above it is the invalidation level.
The measured objective of a head-and-shoulders-top is the vertical distance from the head high to the neckline, subtracted from the neckline. That figure is treated as approximate.
Confirmation still needs a stop-loss
A hammer, a long lower shadow with a small real-body near the top of the session range, is used as confirming evidence when it appears near a head-and-shoulders measured objective.
On a broken head-and-shoulders-top, a close back through the neckline is the stop-loss that marks the idea as wrong.
Coherent candle use is described as combining pattern recognition with a stop-loss, a risk-reward check, placement of the pattern in the larger trend, and monitoring after the position is open.
S&P 500 weekly head-and-shoulders, 775 objective
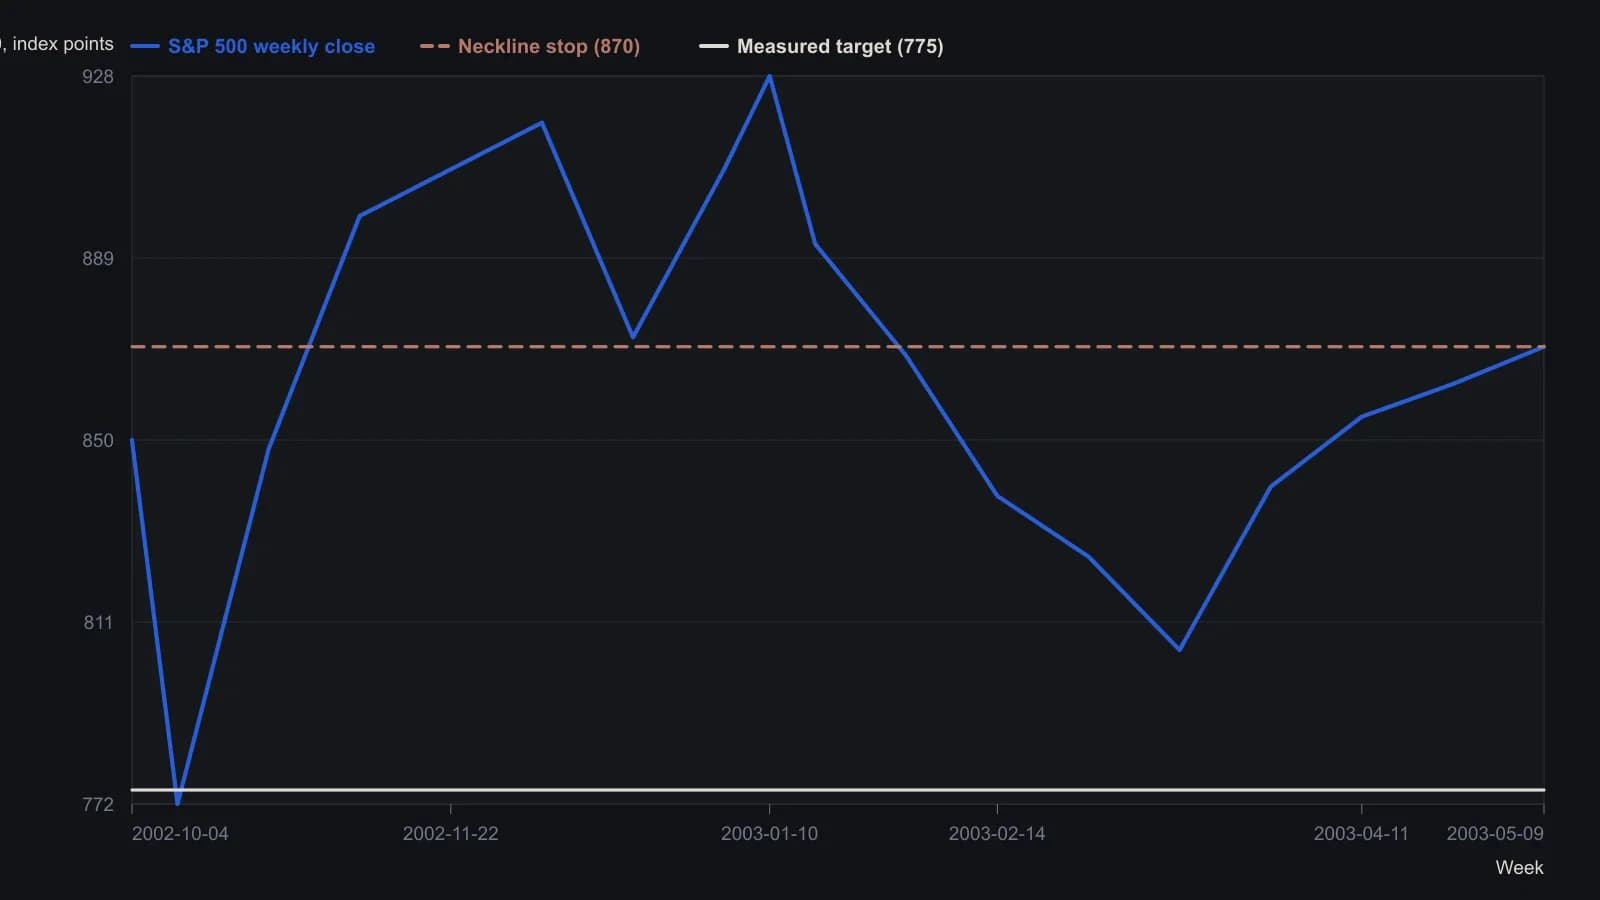
Weekly closes are approximate to the published raster. Nison calls the 775 objective approximate. The 789 March print is the hammer week's low, not that week's close.
All readings on this track · 37 readings
- 1982Head and shoulders as a three-path completion test
- 1984Stock low clusters as a cycle baseline
- 1985Four-phase construction of the head-and-shoulders reversal
- 1989Volume-confirmed reversal patterns, stops, and measured objectives
- 1991The journal as one checklist for taken and skipped trades
- 1991Head and shoulders as a direction hypothesis
- 1991Candlestick body and shadow construction with three-Buddha peaks
- 1992A three-count drill that binds candlesticks, head and shoulders, and entry rules
- 1997Constructing bump and run reversal channels
- 1998Testing reversal formations in bond futures
- 1999Construction first: extra shoulders, the neckline, and the diamond test
- 1999Dead-cat bounce, rollover, and failed reversals
- 1999Evaluating time gaps in bond reversal patterns
- 2000Constructing head and shoulders and double reversal patterns
- 2001Constructing broadening and complex bottoms
- 2001Constructing a slanted head-and-shoulders when the chart is tilted
- 2002Head and shoulders with dominant-cycle timing
- 2002Trendline breaks, right shoulders, and trailing stops
- 2003Confirmation tests for bearish top patterns
- 2003Commodity top hypotheses on a dollar rebound
- 2003A head-and-shoulders test during a bear rally
- 2004Pattern breakouts need a primary-trend filter
- 2004Reading candlestick closes on trendline and neckline tests
- 2004Candle diagnosis needs Western targets and stops
- 2004Head-and-shoulders neckline construction
- 2005A familiar chart condition is a hypothesis, not a completed decision
- 2005A 50-day ceiling and a rising-floor stalemate
- 2006A complete trading plan from philosophy to checklist
- 2006Thin-market head and shoulders with two averages and MACD confirmation
- 2010Head and shoulders as a playback-tested setup
- 2011Turning a head-and-shoulders outline into a breakout hypothesis
- 2011Volume-confirmed head and shoulders on AIG and Citigroup in 2007
- 2013Constructing head-and-shoulders milestone points
- 2013Head-and-shoulders geometry versus the filter stack
- 2013Algorithmic head-and-shoulders construction
- 2018International relative strength as a double-top case study
- 2019Structure invalidation before comfort-stops