1993issue C061-11
Nested centered channels with a commodity channel index confirmation gate
Centered moving averages and percentage price channels are stacked so a short-cycle extreme against a longer envelope opens a reversal window first. The commodity channel index is then admitted only as a sequenced overlay, never as a standalone trade cue.
- A centered moving average is plotted backward by about half its lookback so the printed value sits at the middle of the sample, retaining longer fluctuations and diminishing shorter ones.
- Cycle nesting treats contact between a short price-channel extreme and a longer envelope as the reversal window, before any oscillator is consulted.
- The commodity channel index enters only after that window, and only through a fixed order: a recent reading beyond +200 or -200, matching divergence, an oscillator-line break, then a price-line break.
- Zero-line regime flags the immediate trend and governs later hold, exit, and acceleration readings. It is not a first-entry substitute for the channel stack.
A cycle clock, then a confirmation gate
The archive workflow starts with a moving average of a chosen length. That smoother is described as retaining fluctuations longer than its lookback and diminishing shorter ones. The plot is not left on the current bar. It is shifted backward by half the lookback so the printed value sits at the middle of the sample. In this method that recentered plot is the centered moving average.
Editorial interpretation: TradersWeek reads the stacked channels as a cycle clock that opens a reversal window first. The commodity channel index is admitted only after that window is framed, so an oscillator extreme is never treated as a standalone trade cue.
How the centered channel is drawn
Once the centered average is placed, a variance envelope is drawn as a percentage of that average through most price extremes. A smaller percentage is used on shorter lookbacks and a larger percentage on longer lookbacks, so cycle amplitude is read from the envelope width. That envelope is the price channel in this method.
Weekly examples pair a 20-period centered average, offset 11 periods, and 4% bands with either an 80-period average offset 41 periods and 12% bands or a 40-period average and 8% bands.
The same 20- and 80-period centered averages appear across timeframes with different envelope widths: 4% and 12% on weekly charts, 1.25% and 3% on daily charts, and 0.5% and 1.0% on hourly charts.
When the nested envelopes meet
Cycle nesting overlays the shorter and longer centered channels. When a shorter-cycle envelope meets the boundary of a longer-cycle envelope, price is described as often reversing toward the longer cycle’s average or the opposite band of that larger channel.
Editorial interpretation: that contact is the candidate reversal window. The oscillator is not consulted as a first cue.
Weekly DJIA with nested 20-week and 80-week centered channels
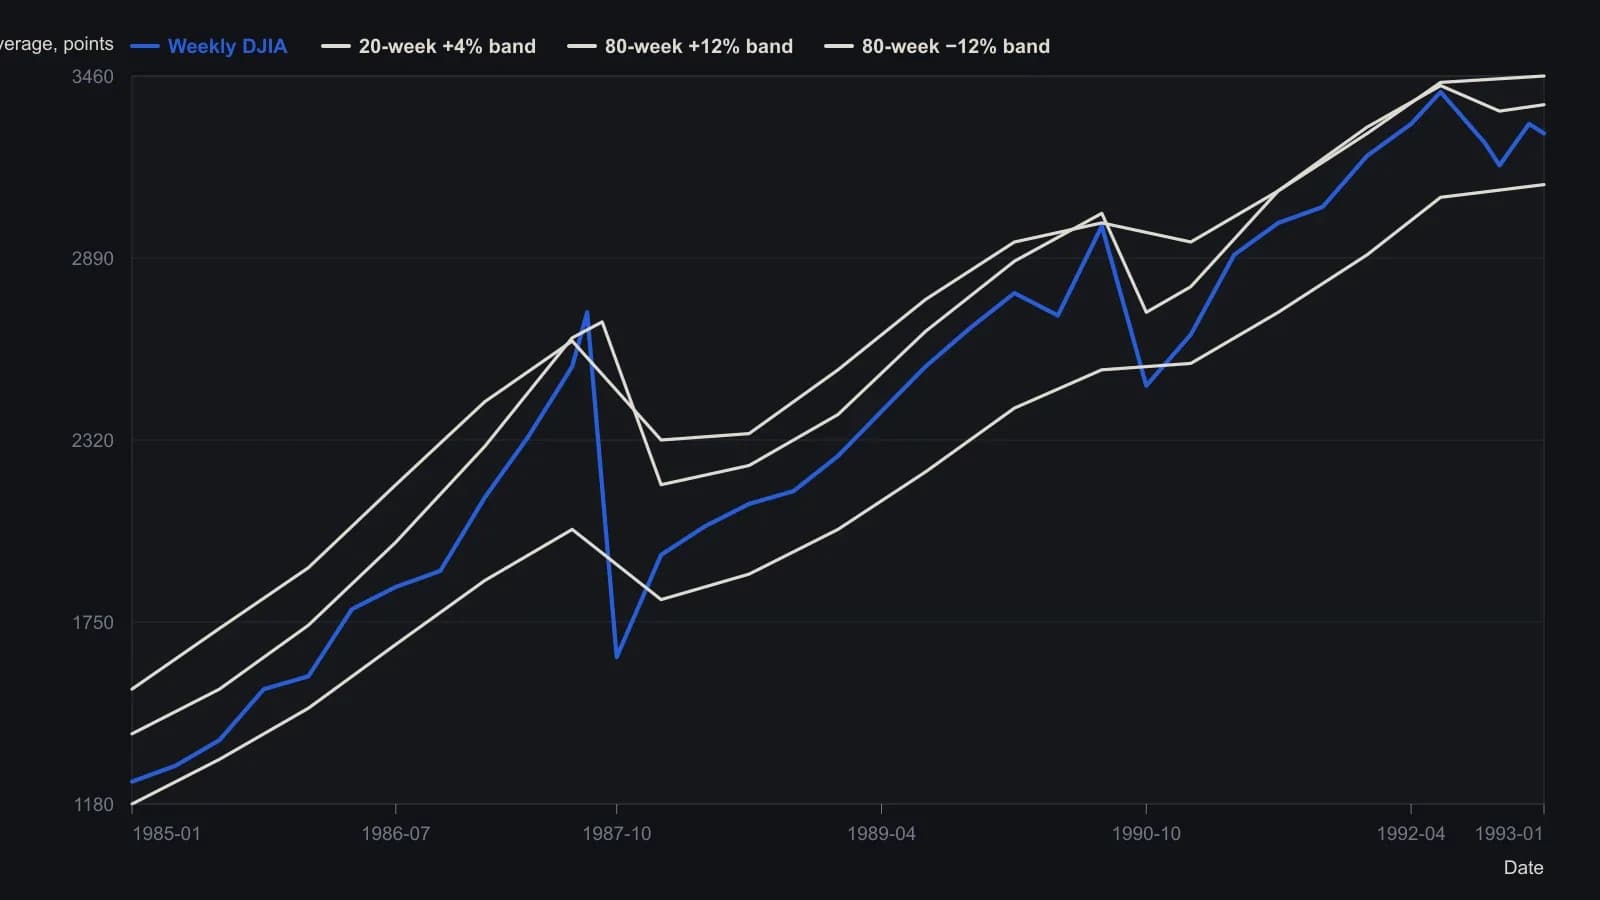
Averages are centered (20-week displaced 11 weeks, 80-week displaced 41 weeks) with 4% and 12% envelopes. Right-hand dotted segments on the plate are hand projections, not computed averages. Y-values are DJIA points; the printed scale labels tenths of a point (27000 = 2700). Crash week uses the visible intraweek low. Digitized from the raster, so values are approximate to the nearest 10 points.
The oscillator as a later overlay
The commodity channel index is defined as typical price minus its simple moving average, divided by 0.015 times the mean deviation of typical price. Typical price is the mean of high, low, and close.
Readings beyond +200 and -200 are treated as overbought and oversold. Suggested lookbacks are 80 periods on intraday charts, 40 on daily and weekly charts, and 20 on monthly charts. Values above zero mark an immediate uptrend and values below zero an immediate downtrend. That sign is the zero-line regime.
The oscillator is presented as a timing overlay on multi-period centered price channels, not as a standalone timing device. The pairing of 20- and 80-period channels with a matching-period oscillator is applied across stocks, indices, commodities, and chart intervals.
The contemplated confirmation sequence
A contemplated entry sequence requires a recent reading beyond the +200 and -200 levels, recent divergence between matching price and oscillator extremes, a break of a line drawn on the oscillator, and only then a break of the corresponding price trendline.
Open positions are described as held until the oscillator reverses through its own trendline, with a complete exit if it crosses zero. After a new trend is under way, a later zero-line recross in the trend direction is treated as acceleration rather than a first-entry cue.
Editorial interpretation: TradersWeek treats this order as the confirmation gate. Cycle nesting opens the window. The commodity channel index may then confirm, hold, exit, or mark acceleration. It does not replace the channel clock.
All readings on this track · 39 readings
- 1982Three gates on a 1982 pork-belly short
- 1982Scale-free Commodity Channel Index construction
- 1986Constructing a commodity channel index and a regression price channel
- 1987Constructing scaled OHLC matrices for study overlays
- 1987Constructing the commodity channel, average directional, and relative strength indexes on a shared cycle scale
- 1992Eleven-bar commodity channel index from typical price and mean deviation
- 1992Evaluating Commodity Channel Index breakout versus range rules
- 1992Evaluating breakout and CCI rules as complete mechanical procedures
- 1993Constructing stochastic, RSI and CCI inputs for forecasts
- 1993Nested centered channels with a commodity channel index confirmation gate
- 1993Listed-option timing as three separable clocks
- 1994Constructing an eleven-period commodity channel index
- 1994Confirming Elliott wave turns with channels and the commodity channel index
- 1995Commodity Channel Index band rules lag zero-line timing
- 1995Building the commodity channel index from typical price
- 1995Staged reversal rules with commodity channel index and average channels
- 1995Commodity channel index construction from typical price to a smoothed zero line
- 2001Reader tests for unfinished lookback oscillators
- 2002Constructing the commodity channel index from typical price
- 2003Breadth-filtered commodity channel index entry and exit rules
- 2003Constructing the Commodity Channel Index from typical price and scaled deviation
- 2003A shallow, poorly participated advance is an unconfirmed trend
- 2003CCI and RSI parameter defaults as scaling conventions
- 2003A cost and capital audit of a Commodity Channel Index trade engine
- 2003Commodity channel index peak divergence as an exit after twin patterns
- 2004Constructing the Commodity Channel Index from typical price
- 2004Constructing the Commodity Channel Index from typical price and mean deviation
- 2006Building custom indicators from the Commodity Channel Index, a least squares moving average and a rule-based entry
- 2012Confirming breakouts and retracements with CCI, ADX, and averages
- 2012Stacking oscillator lookbacks into a heatmap mosaic
- 2013Constructing a consensus and volatility-normalized value oscillator
- 2013Walk-forward system evaluation with a commodity channel index and chandelier exits
- 2014Dual detrended oscillators and dual Bollinger Band channels
- 2014RSI, CCI, and moving-average trend-filter construction
- 2014Dual RSI, a moving average, and CCI as a confirmation stack
- 2017Constructing dual-average cross and channel-index filters
- 2018Treat CAM as a classification layer before confirmation becomes an entry
- 2018Four-state slope labels gated by a moving average and a commodity channel index
- 2018Deviation-Scaled Moving Average construction from a two-bar difference