1998issue C031-11
Treat RSI as a testable filter rather than a trigger
Wilder's RSI is a 0-100 oscillator of a security's own up-close versus down-close momentum. This archive article pairs overbought and oversold warning zones with divergence and nearby support or resistance, so a reading is judged by whether the chart can still absorb a failed signal.
- RSI is a 0-100 oscillator of a security's own up closes versus down closes, not a comparison of one security with another.
- Readings below 30 and above 70 are oversold and overbought warning zones, not automatic proof that a trend has ended.
- Shorter lookbacks produce more and noisier signals, while doubling a working window often reduces the signal count.
- Weigh a reading against nearby support and resistance so the downside if it fails can be compared with the remaining upside.
What the oscillator measures
Wilder's RSI is a 0-100 oscillator of a security's own up-close versus down-close momentum. It is not a comparison of one security with another.
In this archive usage, the relative strength index compares a security's recent up closes with its own down closes over a chosen lookback.
Lookbacks and warning zones
Common lookbacks include 9, 14, 16, 25 and 28 periods. Shorter windows produce more and noisier signals, while doubling a working window often reduces the signal count.
Readings below 30 and above 70 are treated as oversold and overbought warning zones, not as automatic proof that a trend has ended.
When price and the oscillator disagree
Divergence is a chart condition in which price and the oscillator fail to confirm each other's successive highs or lows.
A one-year, 285-stock check of 9-day RSI divergences counted 98 of 115 tops and 130 of 145 bottoms as correct, with W and M failure swings correct in 185 of 254 cases.
Room for a failed reading
Support and resistance are price zones where prior turning points can be used to size the downside or upside if an oscillator signal is wrong.
A signal should be weighed against nearby support and resistance so the downside if the reading fails can be compared with the remaining upside.
Gleason RSI crossing 30 and 70 too early
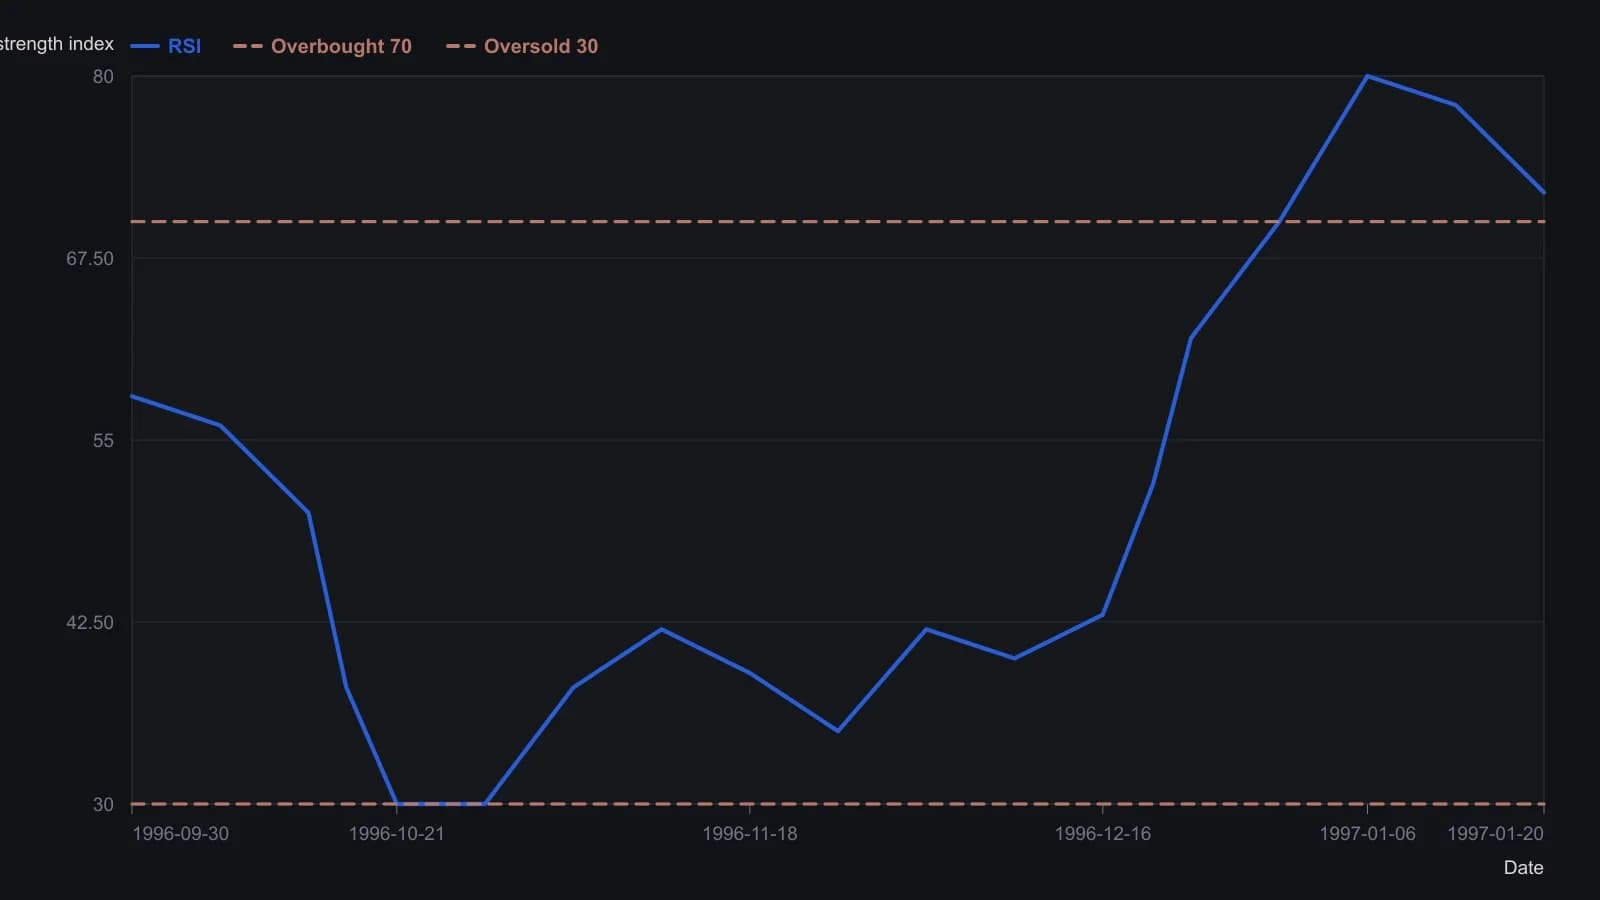
The source pane uses the 30 and 70 warning lines. Its buy and sell marks sit on the raw crosses, which arrived before the October low and before the January high.
How the archive compared two rules
On a 16-day lookback, buying below 30 and selling above 70 was reported as 55 profitable trades out of 59, with an average gain of 17% and an average hold of 82 days.
Delaying the same 16-day 30/70 rule until RSI recrossed 30 or 70 reduced the average gain to 15% and produced worse average fill prices after the wait.
The evaluation used 242 stocks over roughly two years rather than a market index, covering more than 50 industrial sectors.
All readings on this track · 32 readings
- 1989Volume confirmation windows and exponential average construction
- 1990Constructing stochastic %K and %D from range position
- 1990Build a weekly leading sector composite from scaled transports and financials
- 1990Constructing stochastic K and D lines and divergence cues
- 1993Relative strength index events depend on the chosen input combination
- 1995Constructing a dual-horizon force index
- 1996Building a range-normalized divergence index from relative strength index
- 1998Treat RSI as a testable filter rather than a trigger
- 1999Primary-cycle windows, then stochastic confirmation
- 1999Stochastic rules versus buy and hold
- 2001Constructing confirmation filters for RSI overbought and oversold extremes
- 2003Constructing divergence-equivalent relative strength index and stochastic oscillators
- 2003Reverse-engineered RSI as a next-close projection
- 2003Scoring open versus resolved relative strength divergences
- 2003Bull-and-bear-balance from OHLC bar patterns
- 2003Constructing bull and bear balance from session paths
- 2004Four-month rule: auto stocks as a market-regime warning
- 2004Constructing stochastic oscillator bands, crosses and divergence
- 2004Volume as an independent check on price oscillators
- 2004Simple dual confirmation for a short-horizon index-futures system
- 2005Confirm a stochastic divergence by reclaiming the first-swing bar
- 2005Weekly stochastic divergence and a long average on 2005 high-yield entrants
- 2005Predicted averages from related market baskets
- 2006Rank price-oscillator divergences, then filter by trend
- 2006Relative-spread-strength for cycle confirmation
- 2007Weekly breakout stretch and histogram divergence
- 2011A luxury-auction stock as a cross-market bubble warning
- 2014Running-percentile close divergences and trend filters
- 2015Rebuilding the relative strength index from close-to-average gaps
- 2016Constructing higher-high and lower-low stochastic pairs
- 2018Constructing composite relative-strength-index stochastics for reversal confirmation
- 2019Building a smoothed Stochastic oscillator of the Relative Strength Index for Price-indicator divergence checks