2005issue C111-4
Predicted averages from related market baskets
A moving-average forecast is read here only after the target market is placed in a related-market-basket, with the predicted-average-spread used as a divergence check on the single-market baseline.
- Between about six months and three years, many newer traders shift from hunting a single universal system to accepting that no such system exists.
- Intermarket analysis places commodities, equities, notes, and later currencies in a four-asset-class-frame so one market is not read from its own history alone.
- A related-market-basket can feed a predicted-moving-average that is built to lead, rather than trail, the target's own price.
- The archive treated predicted five-day and 10-day average-difference lines as a divergence surface, on the claim that lasting signal systems need global, multi-asset inputs.
From a universal system to related markets
Between about six months and three years, many newer traders shift from hunting a single universal system to accepting that no such system exists.
The archive contrasts traders who quit, traders who cling to one unchanging system, and traders who keep revising methods as new information and relationships appear.
A four-asset-class-frame
Intermarket analysis, named in 1991, is presented as the study of how commodities, equities, and notes affect one another, with currencies added later as a fourth asset class.
The four-asset-class-frame treats equities, notes, commodities, and currencies as the minimum set for putting one trade into broader market context. Intermarket analysis, in this usage, is reading one market through prices and relationships in other asset classes instead of from that market's own history alone.
What the historical charts showed
Charts covering 1998 through 2005 show a close equity-index pair moving together, while equities and 10-year notes moved apart after 1998 and together again in late 2003 after a deflation scare tied to the 1997 Asian currency crisis faded.
The same chart set also pairs a broad equity index with a technology index, a Japanese equity index, and a dollar index to illustrate sector, country, and currency linkages.
A related-market-basket forecast
A 2005 construction combined a futures contract's open, high, low, close, volume, and open interest with the same six fields from as many as nine related markets to produce forecast moving-average lines rather than lagging averages of the target alone.
A related-market-basket is a fixed set of correlated indexes, notes, and currencies whose open, high, low, close, volume, and open interest feed a single forecast. Related markets listed for a broad equity-index forecast included a blue-chip average, a utilities average, a technology index, a dollar index, a Japanese equity index, the cash equity index, 10-year and 2-year notes, and a composite exchange index.
The predicted-moving-average is a moving-average-like line estimated from the target market plus that basket, built to lead rather than trail the target's own price.
A daily predicted-average reading
On a daily equity-index example dated 26 July 2005, an actual 10-day average of 1232.31 sat beside a predicted 10-day average of 1233.82 and predicted five-day and 10-day average differences of 1.58 and 1.51, with a binary predicted index of 1.00.
A long condition was defined only when both predicted-average-difference lines and the binary index were positive. A short or long-exit condition was defined when those differences were negative and the index was zero. Extremes on the same lines were treated as caution flags.
The spread as a divergence surface
The predicted-average-spread is the difference between a predicted short- or intermediate-horizon average and the corresponding actual average, plotted as an oscillator-like series.
The archive treated the predicted five-day and 10-day average-difference lines as a divergence surface comparable to a conventional oscillator. Divergence is a checkable disagreement between price direction and a predicted-average spread or similar oscillator, used as a caution or confirmation condition.
The archive used that surface to support the claim that lasting signal systems need global, multi-asset inputs rather than one market's open, high, low, close, and volume alone.
Editorial: a weekly confirmation test
Editorial reading: After the basket and the predicted-moving-average are in place, the predicted-average-spread is the object that can confirm, weaken, or veto the single-market baseline. That habit belongs to a weekly horizon. It is not a claim that the historical long and short rules still apply.
S&P 500 predicted versus actual moving-average spread
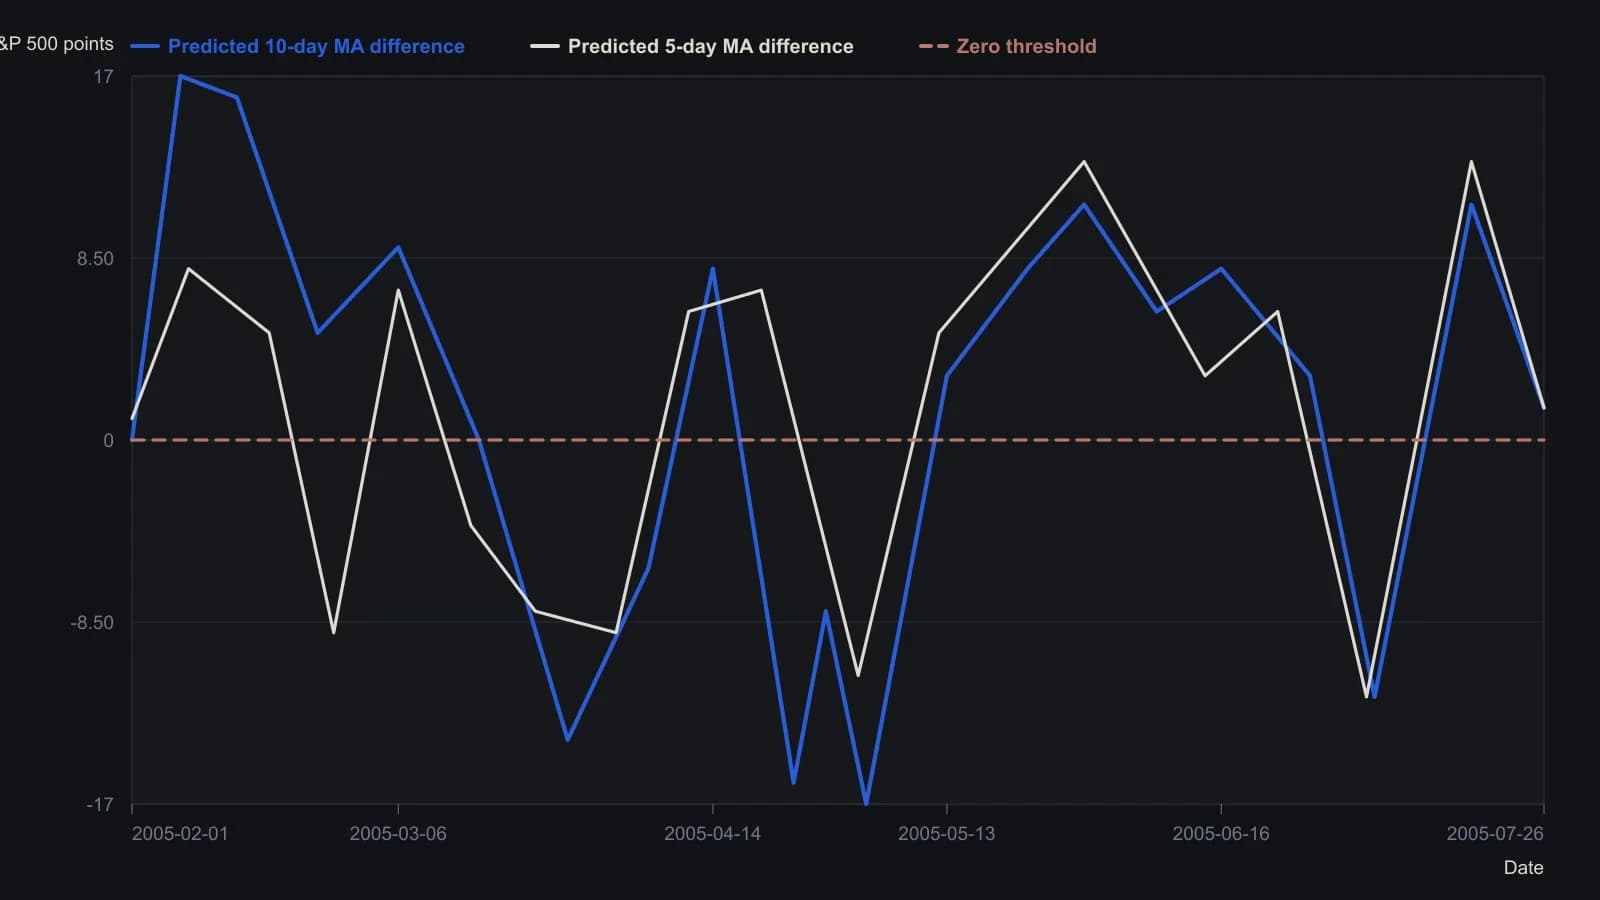
Horizontal dates are interpolated from the Feb–Jul 2005 month ticks; vertical values are read from the printed ±19.24 difference scale, so expect about one index point of error. The last bar is the 26 July 2005 close printed on the figure. VantagePoint forms these leading averages from the S&P plus a fixed nine-market basket.
All readings on this track · 32 readings
- 1989Volume confirmation windows and exponential average construction
- 1990Constructing stochastic %K and %D from range position
- 1990Build a weekly leading sector composite from scaled transports and financials
- 1990Constructing stochastic K and D lines and divergence cues
- 1993Relative strength index events depend on the chosen input combination
- 1995Constructing a dual-horizon force index
- 1996Building a range-normalized divergence index from relative strength index
- 1998Treat RSI as a testable filter rather than a trigger
- 1999Primary-cycle windows, then stochastic confirmation
- 1999Stochastic rules versus buy and hold
- 2001Constructing confirmation filters for RSI overbought and oversold extremes
- 2003Constructing divergence-equivalent relative strength index and stochastic oscillators
- 2003Reverse-engineered RSI as a next-close projection
- 2003Scoring open versus resolved relative strength divergences
- 2003Bull-and-bear-balance from OHLC bar patterns
- 2003Constructing bull and bear balance from session paths
- 2004Four-month rule: auto stocks as a market-regime warning
- 2004Constructing stochastic oscillator bands, crosses and divergence
- 2004Volume as an independent check on price oscillators
- 2004Simple dual confirmation for a short-horizon index-futures system
- 2005Confirm a stochastic divergence by reclaiming the first-swing bar
- 2005Weekly stochastic divergence and a long average on 2005 high-yield entrants
- 2005Predicted averages from related market baskets
- 2006Rank price-oscillator divergences, then filter by trend
- 2006Relative-spread-strength for cycle confirmation
- 2007Weekly breakout stretch and histogram divergence
- 2011A luxury-auction stock as a cross-market bubble warning
- 2014Running-percentile close divergences and trend filters
- 2015Rebuilding the relative strength index from close-to-average gaps
- 2016Constructing higher-high and lower-low stochastic pairs
- 2018Constructing composite relative-strength-index stochastics for reversal confirmation
- 2019Building a smoothed Stochastic oscillator of the Relative Strength Index for Price-indicator divergence checks