1999issue C031-7
Primary-cycle windows, then stochastic confirmation
The archive workflow names a roughly 17-week primary cycle, opens a four-week window around expected troughs and crests, and then looks for stochastic or intermarket nonconfirmation. Editorial reading: treat the cycle as a calendar first, and use the oscillator only to decide whether a turn is forming.
- Name a roughly 17-week primary cycle first and treat its four-week window as a calendar around expected troughs and crests, not as an automatic trade.
- Inside that swing, label three six-week phases, two nine-week phases, or a mix of both, and time those nested phases on daily index charts.
- In the S&P futures sample, bullish stochastic divergence appeared at 25 of 44 primary bottoms, and bearish oscillator or intermarket nonconfirmation appeared at most documented primary tops, but not at every turn.
- Editorial reading: the cycle supplies the when; use stochastic disagreement, and multiple-time-frame alignment, only as the whether.
Name the primary cycle first
The study treats a roughly 17-week primary cycle, with a four-week timing window, as the trader's comfort-zone cycle. That rhythm links shorter nested phases to a longer 50-week cycle. Expected troughs and crests are first marked as calendar windows on that primary rhythm.
Editorial reading: treat the named dominant cycle as a calendar window first. The window tells you when a turn is due. It does not, by itself, tell you whether to act.
Time the nested phases
Inside that primary cycle the author looks for either three six-week phases, two nine-week phases, or a mix of both. Troughs and crests are labelled so each subcycle phase can be timed on daily index charts. The shorter rhythm is a timing tool within the larger swing, not a substitute for the primary window.
Wait for the shorter chart to agree
Cycle work is paired with multiple-time-frame alignment. A shorter interval is used for entry only after it starts moving with the trend of the next longer interval.
What the historical sample recorded
In the S&P futures sample, bullish stochastic divergence appeared at 25 of 44 primary bottoms. That setup is price making a new primary-cycle low while the stochastic oscillator does not.
Bearish oscillator divergence at primary-cycle crests was more frequent than the bullish counterpart at troughs. It occurred in 33 of 44 S&P futures crests.
Across 45 crest cases, 41 showed either intermarket bearish divergence or oscillator bearish divergence. Intermarket divergence is a nonconfirmation between two related markets, such as S&P futures and the Dow Jones Industrial Average, at a candidate cycle turning point. At least one of those nonconfirmations was present at most documented primary tops.
S&P 500 futures primary-cycle lengths, 1982–1997
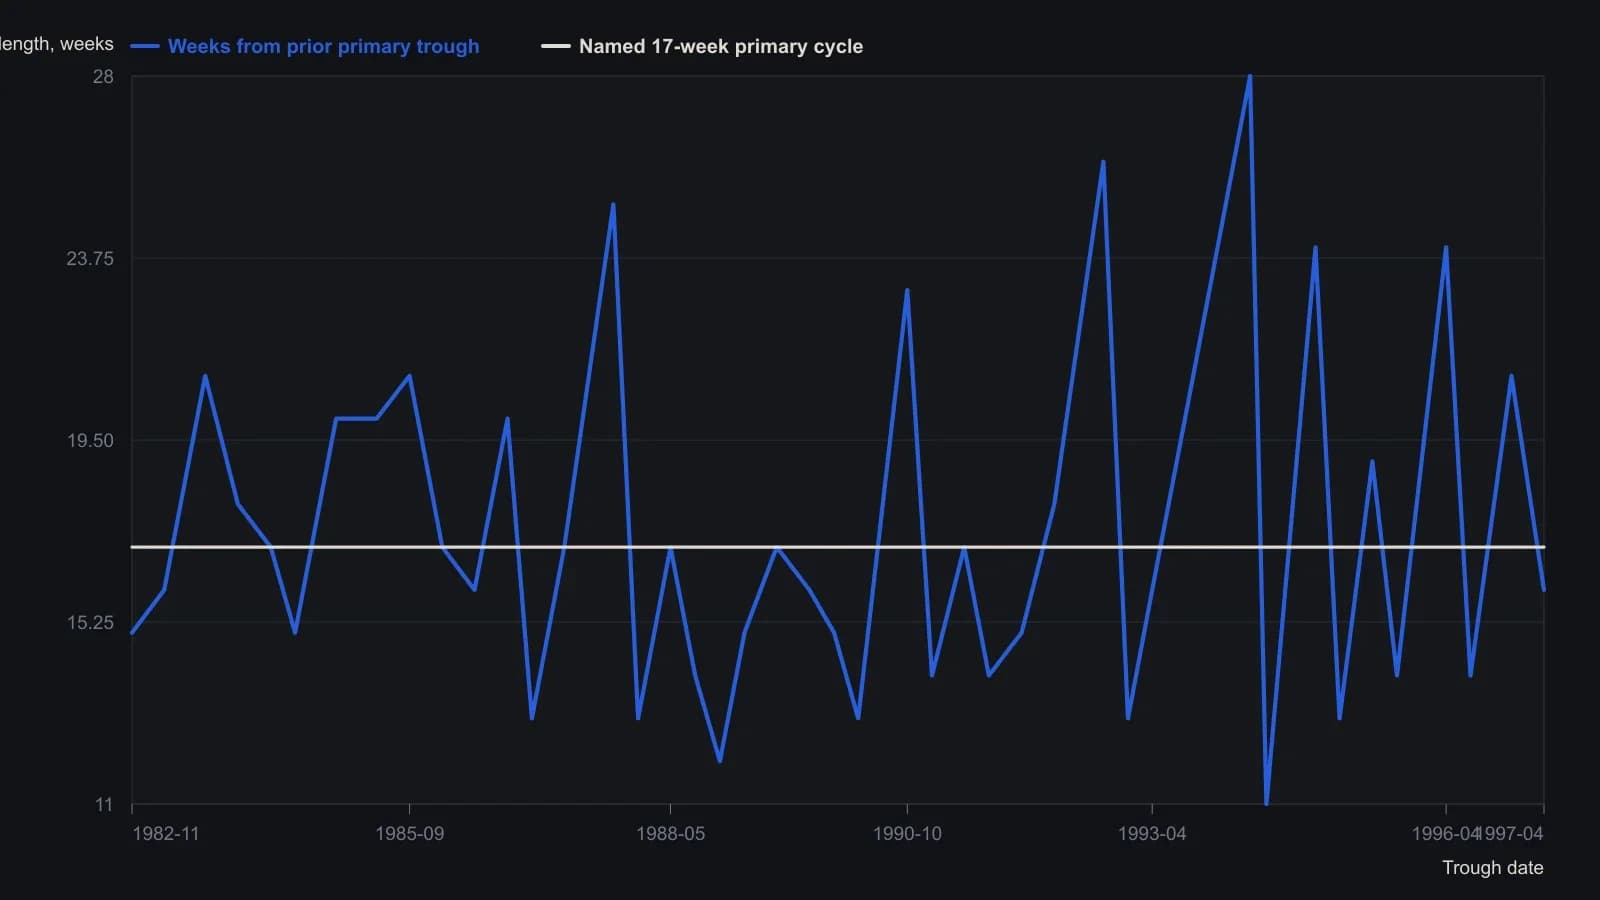
Parentheses in the source list are weeks from the prior primary trough, not months. Asterisked cycles coincided with a four-year cycle. The author counts 36 of 44 cases (81.8%) in the 13–21 week interval; six of the eight distortions lasted 23–28 weeks. The first printed date, August 1982, is the start of cycle 1 and has no length of its own.
How the pieces work together
Editorial reading: keep the jobs separate. The primary cycle supplies the when. The stochastic oscillator supplies the whether, and only when price and the oscillator disagree inside the open window. Intermarket nonconfirmation can play the same confirmation role at a candidate crest. Even then, wait until the shorter chart begins to move with the next longer chart.
All readings on this track · 32 readings
- 1989Volume confirmation windows and exponential average construction
- 1990Constructing stochastic %K and %D from range position
- 1990Build a weekly leading sector composite from scaled transports and financials
- 1990Constructing stochastic K and D lines and divergence cues
- 1993Relative strength index events depend on the chosen input combination
- 1995Constructing a dual-horizon force index
- 1996Building a range-normalized divergence index from relative strength index
- 1998Treat RSI as a testable filter rather than a trigger
- 1999Primary-cycle windows, then stochastic confirmation
- 1999Stochastic rules versus buy and hold
- 2001Constructing confirmation filters for RSI overbought and oversold extremes
- 2003Constructing divergence-equivalent relative strength index and stochastic oscillators
- 2003Reverse-engineered RSI as a next-close projection
- 2003Scoring open versus resolved relative strength divergences
- 2003Bull-and-bear-balance from OHLC bar patterns
- 2003Constructing bull and bear balance from session paths
- 2004Four-month rule: auto stocks as a market-regime warning
- 2004Constructing stochastic oscillator bands, crosses and divergence
- 2004Volume as an independent check on price oscillators
- 2004Simple dual confirmation for a short-horizon index-futures system
- 2005Confirm a stochastic divergence by reclaiming the first-swing bar
- 2005Weekly stochastic divergence and a long average on 2005 high-yield entrants
- 2005Predicted averages from related market baskets
- 2006Rank price-oscillator divergences, then filter by trend
- 2006Relative-spread-strength for cycle confirmation
- 2007Weekly breakout stretch and histogram divergence
- 2011A luxury-auction stock as a cross-market bubble warning
- 2014Running-percentile close divergences and trend filters
- 2015Rebuilding the relative strength index from close-to-average gaps
- 2016Constructing higher-high and lower-low stochastic pairs
- 2018Constructing composite relative-strength-index stochastics for reversal confirmation
- 2019Building a smoothed Stochastic oscillator of the Relative Strength Index for Price-indicator divergence checks