2003issue C071
Scoring open versus resolved relative strength divergences
A standard 14-period relative strength index is a 0-to-100 line built from the RS ratio and read against price. This archive case keeps every price-indicator divergence under one editorial drill: label the disagreement as already confirmed by a later swing, or still open.
- A standard relative strength index maps a 14-period RS ratio of average up-closes to average down-closes onto a 0-to-100 scale.
- The same line is also used to mark extremes, confirm chart patterns, read failure swings, locate support and resistance, and spot divergences versus price.
- A first-half 2003 S&P 500 example showed a February-to-March positive divergence that later resolved higher, and a later negative divergence that was still open.
- Editorial reading: score each disagreement as already confirmed by a later swing or still open, and keep both labels inside the same falsifiable rule set.
The same 0-to-100 line
A relative strength index is a 0-to-100 oscillator built from the RS ratio. That ratio is the lookback average of up-closes divided by the lookback average of down-closes, then rescaled into the oscillator. A standard reading uses a 14-period lookback.
Daily oscillator values are connected into a continuous line that is read against the corresponding price chart. The same oscillator is described as useful for marking extremes, confirming chart patterns, reading failure swings, locating support and resistance, and spotting divergences versus price.
A failure swing is an oscillator reversal reading grouped with those other uses as another way to interpret the same line.
Two directions of disagreement
A price-indicator divergence is a chart condition in which successive highs or lows in the oscillator move opposite the corresponding highs or lows in price.
A positive divergence is defined as the oscillator pointing toward firmer price action while the price series itself continues to decline. In the wording fixed for this archive, that is a disagreement in which the oscillator forms a higher low while price continues to form lower lows.
A negative divergence is defined as the oscillator making lower highs while price continues to make higher highs.
One resolved case and one open case
On a first-half 2003 S&P 500 chart, the oscillator made a higher low from early February into early March while the index made lower lows. That February-to-March disagreement was later followed by an upside resolution in the index in mid-March.
From mid-March into May 2003 the same S&P 500 example showed higher price highs against lower oscillator highs, and that disagreement was still unresolved at the time of writing.
Daily 14-period RSI on the S&P 500, November 2002 to May 2003
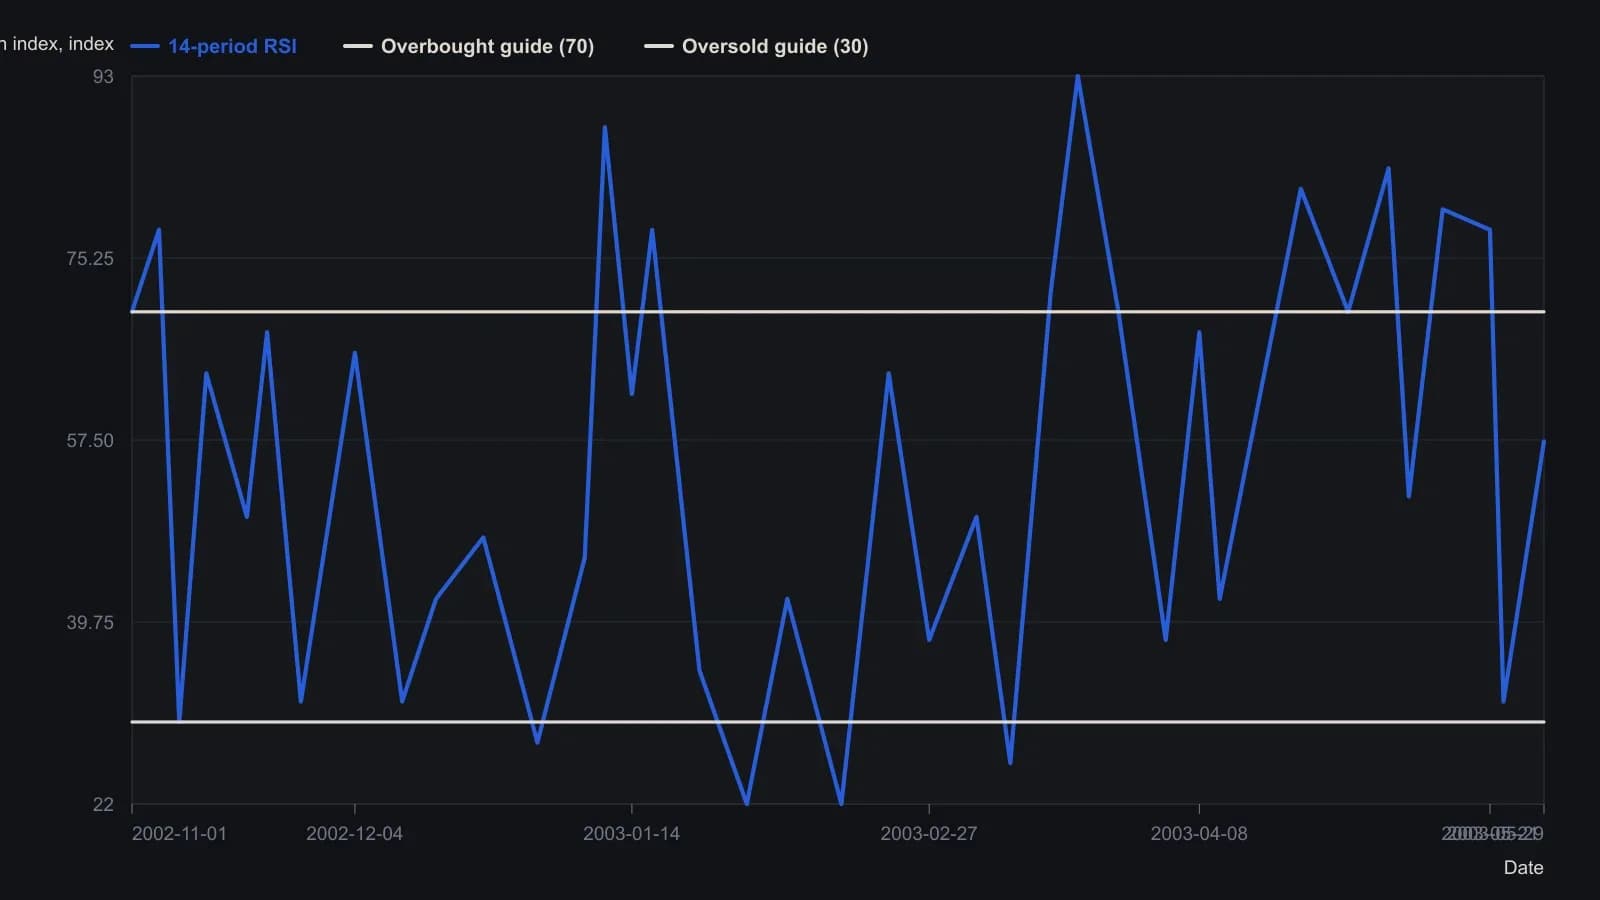
Fourteen-period RSI as plotted on the TradeStation daily pane. Session dates are inferred from the month axis, not printed timestamps. Apart from the printed 57.36 close and the 30/70 guides, levels are raster readings rounded to whole index points.
An editorial classroom drill
Editorial interpretation: treat the 14-period overlay as a classroom drill. Label each price-oscillator disagreement as already confirmed by a later swing, or still open. The mid-March upside move lets the first disagreement be labelled confirmed. The later disagreement stays labelled open because it was still unresolved in the same record.
Both labels stay inside one falsifiable rule set. The archive does not assign those classroom labels.
All readings on this track · 32 readings
- 1989Volume confirmation windows and exponential average construction
- 1990Constructing stochastic %K and %D from range position
- 1990Build a weekly leading sector composite from scaled transports and financials
- 1990Constructing stochastic K and D lines and divergence cues
- 1993Relative strength index events depend on the chosen input combination
- 1995Constructing a dual-horizon force index
- 1996Building a range-normalized divergence index from relative strength index
- 1998Treat RSI as a testable filter rather than a trigger
- 1999Primary-cycle windows, then stochastic confirmation
- 1999Stochastic rules versus buy and hold
- 2001Constructing confirmation filters for RSI overbought and oversold extremes
- 2003Constructing divergence-equivalent relative strength index and stochastic oscillators
- 2003Reverse-engineered RSI as a next-close projection
- 2003Scoring open versus resolved relative strength divergences
- 2003Bull-and-bear-balance from OHLC bar patterns
- 2003Constructing bull and bear balance from session paths
- 2004Four-month rule: auto stocks as a market-regime warning
- 2004Constructing stochastic oscillator bands, crosses and divergence
- 2004Volume as an independent check on price oscillators
- 2004Simple dual confirmation for a short-horizon index-futures system
- 2005Confirm a stochastic divergence by reclaiming the first-swing bar
- 2005Weekly stochastic divergence and a long average on 2005 high-yield entrants
- 2005Predicted averages from related market baskets
- 2006Rank price-oscillator divergences, then filter by trend
- 2006Relative-spread-strength for cycle confirmation
- 2007Weekly breakout stretch and histogram divergence
- 2011A luxury-auction stock as a cross-market bubble warning
- 2014Running-percentile close divergences and trend filters
- 2015Rebuilding the relative strength index from close-to-average gaps
- 2016Constructing higher-high and lower-low stochastic pairs
- 2018Constructing composite relative-strength-index stochastics for reversal confirmation
- 2019Building a smoothed Stochastic oscillator of the Relative Strength Index for Price-indicator divergence checks