1986issue C091-10
Constructing bounded relative-strength overlays from oscillator limits
A 10-day close-minus-lagged-close momentum-oscillator can flatten against a steady price step, then turn down while price is already horizontal. The same velocity idea is rebuilt as a 14-period relative-strength map on a 0 to 100 overlay and read through threshold-zones, failure-swings, divergence, and pennants on the index.
- A 10-day close-minus-lagged-close momentum-oscillator can stay flat while price still steps by a constant increment, then turn down while price is already horizontal, because the series tracks rate of change rather than price level.
- One-day extremes that distort the current reading, a Y-scale that is not comparable across instruments, and a growing historical data load are the three construction defects the relative-strength rebuild is written to remove.
- Relative strength is the 14-period average of up closes divided by the 14-period average of down closes; recursive-smoothing then updates those averages from the prior values, and the index is mapped onto the interval from 0 to 100.
- Overlay reading uses threshold-zones above 70 and below 30, a failure-swing after those regions, divergence against a flat or opposing price line, and a pennant break on the index as chart hypotheses.
Start from a lagged close-difference oscillator
A 10-day close-minus-lagged-close series can stay flat while price still steps by a constant increment, then turn down while price is already horizontal, because the series tracks rate of change rather than price level.
Editorial: treat that series as the starting momentum-oscillator. Its slope tracks how fast price is moving and its travel tracks how far that move has gone. The construction problem is to keep that velocity idea after the series flattens, overshoots, and loses a comparable scale.
Three defects that bound the rebuild
That oscillator has three construction defects. One-day extremes distort the current reading. The Y-scale is not comparable across instruments. The historical data load grows with the length of the series. These are the constraints the relative-strength construction is written to remove.
Relative strength as a 14-period ratio
Relative strength is the 14-period average of up closes divided by the 14-period average of down closes. The relative-strength index is then 100 minus 100 divided by one plus that ratio.
After the seed averages, each new pair is obtained by multiplying the prior average by 13, adding today’s up or down close (or zero), and dividing by 14. Later values need only the previous averages and the latest close change. That update is recursive-smoothing: it multiplies the prior average by one less than the lookback, adds today’s up or down increment (or zero), and divides by the lookback.
Because the mapped index is confined to the interval from 0 to 100, momentum amplitude can be compared across instruments and against prior highs and lows of the same series on one scale.
Ten-day close-difference oscillator on an equal-step price path
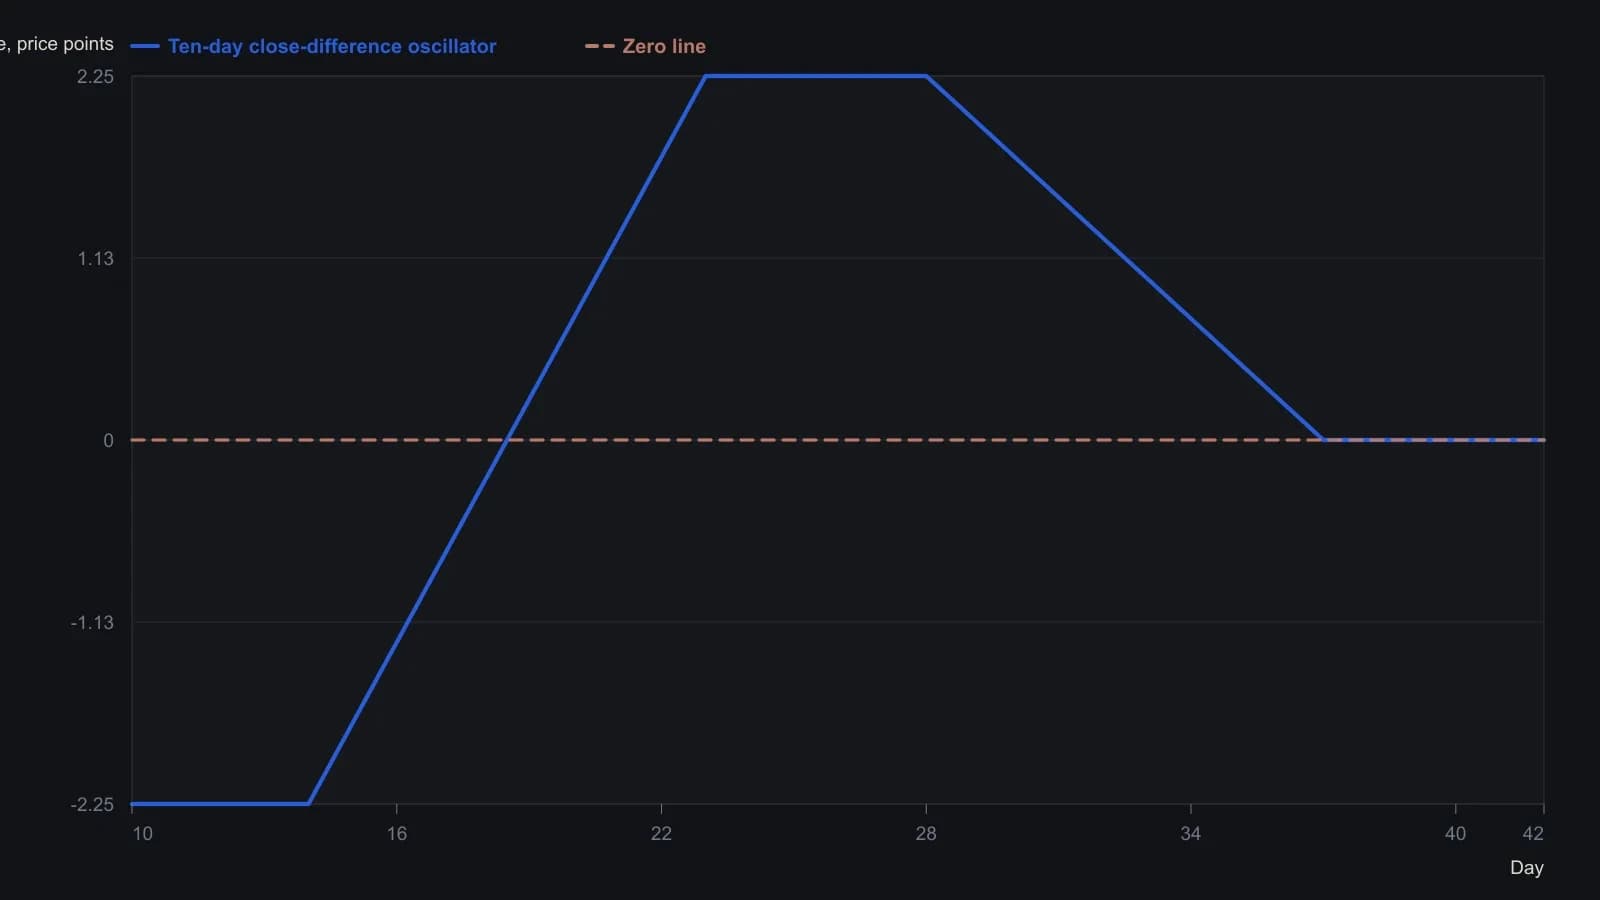
Lookback is fixed at ten sessions on a made-up equal-increment path, not a traded market. Daily points follow that stated increment and the close-minus-lagged-close rule through the named anchors (flat at -2.25 through Day 14, +0.50 jump on Day 15, constant from Day 23, turn down on Day 29, flat at zero after ten sideways sessions).
Threshold-zones and the failure-swing
Overlay reading treats a move above 70 or below 30 as a top or bottom marker that often appears before the price extreme. Those bands are the threshold-zones on the bounded index.
A failure-swing after those regions is treated as a reversal condition. The index has entered the upper or lower threshold-zone and then breaks the intervening swing extreme.
Divergence after a directional move
Divergence is the index rising while price is flat or falling, or the index falling while price is flat or rising. After a directional move it is treated as a turning-point condition.
Pennants that form on the index first
Compact pennant or triangle geometries can form on the index line when they are not visible on the bars. A break of that pennant is read as an intermediate move in the breakout direction.
Editorial: that geometry is the flag-and-pennant hypothesis on the overlay. A compact triangle or pennant can form on the indicator line even when it is not visible on the price bars, and the break is read as a directional continuation hypothesis.
All readings on this track · 26 readings
- 1986Constructing bounded relative-strength overlays from oscillator limits
- 1989Point-and-figure fulcrum, count, and flag as three jobs
- 1996The high, tight flag as a three-checkpoint continuation exam
- 2000Test chart patterns with confirmation, not names
- 2001Failed chart patterns as reverse breakout signals
- 2002Ascending triangle and flag: a three-checkpoint QQQ case study
- 2002Two-stage chart reading after breakouts
- 2002The second pattern after a breakout
- 2003Building flags, pennants, and triangles as continuation pauses
- 2003When trendline channels age into a wedge or a break
- 2004Bearish chart patterns need confirmation before the turn
- 2004Constructing flags, pennants, and triangles from swing pivots
- 2005Constructing flag and pennant rules from pole to exit
- 2005Fanline construction for testing trend health
- 2005When flag-and-pennant breakout scans fail a measurement audit
- 2006Testing a bear-flag target after the pause is confirmed
- 2007Homebuilder rebound as a bear-flag, trendline, and volume case study
- 2008Completed chart patterns as reward-to-risk arithmetic
- 2012Reading this file
- 2012Reading regime change: when to stop trading
- 2014Intraday flag construction with breakout and stop rules
- 2015Lock lookback and chart scale before you mark a flag or pennant
- 2017Constructing delayed buy-stops on bull flags and pennants
- 2018Copy an ABC swing as a ruler, then test flags and Fibonacci degree
- 2019Failed flags, pennants, and triangles as a completed experiment
- 2020Confirming candlestick and flag signals on a weekly chart