2003issue C101-5
Constructing bull and bear balance from session paths
A session-path rebuilds same-bar buyer and seller reach from the prior close through today's open, one extreme, and the close. The resulting bull-power and bear-power units can then be smoothed, checked against price, and turned into a protective offset.
- A consensus-average treats a moving average as the period's agreed price, but high and low residuals still leave the open-to-close path unused.
- The constructed session-path includes the prior close, because omitting it can still print an unrecovered gap as buyer-controlled.
- A smoothing-horizon can average each power and the power-balance difference so the series matches a multi-week hold.
- A histogram turn in power-balance frames a long or short hypothesis, power-divergence is a second check, and a power-stop can be formed from a short average of the same power units.
Why high and low residuals leave a path unused
A moving average can be treated as a consensus-average, the period's agreed price. The session high and the session low are then used as one-bar estimates of buyer reach and seller reach.
Measuring buyer power as the high minus a 13-period exponential average, and seller power as the low minus that same average, leaves the open-to-close path unused.
Averaging three open-high-low-close spans for each side still omits the prior close. A gap that is not recovered can still print as buyer-controlled.
Rebuilding same-bar power on a session-path
The constructed balance series treats the largest rising segment and the largest falling segment on a shortest path as same-day bull-power and bear-power. That session-path runs from the prior close through today's open, one extreme, and the close.
If the move from the prior close to today's open continues in the same direction as the next extreme, those two legs are merged into one segment. Otherwise they stay separate.
When today's open equals today's close, the path is assigned to the larger side of the range. If the close sits at mid-range, the prior close decides which side owns the full range.
Power-balance is the difference between same-bar bull-power and bear-power.
Matching the series to a multi-week hold
For a multi-week hold, a smoothing-horizon applies a 20-period average to each power and a 30-period average to their difference when the intended hold is about three weeks.
Hypotheses from power-balance and power-divergence
A histogram of the power-balance that turns up from below zero is treated as a long hypothesis. A turn down from above zero is treated as a short hypothesis.
Disagreement between price and the series is a second check. Power-divergence is price making a new extreme while the power-balance series fails to confirm.
A protective offset from the same power units
A power-stop can be constructed by adding a 3-to-5-session average of bull-power to the close, or by subtracting the matching bear-power average. The offset may be scaled by a risk coefficient.
Raff Labs bull and bear balance, March 2000–December 2001
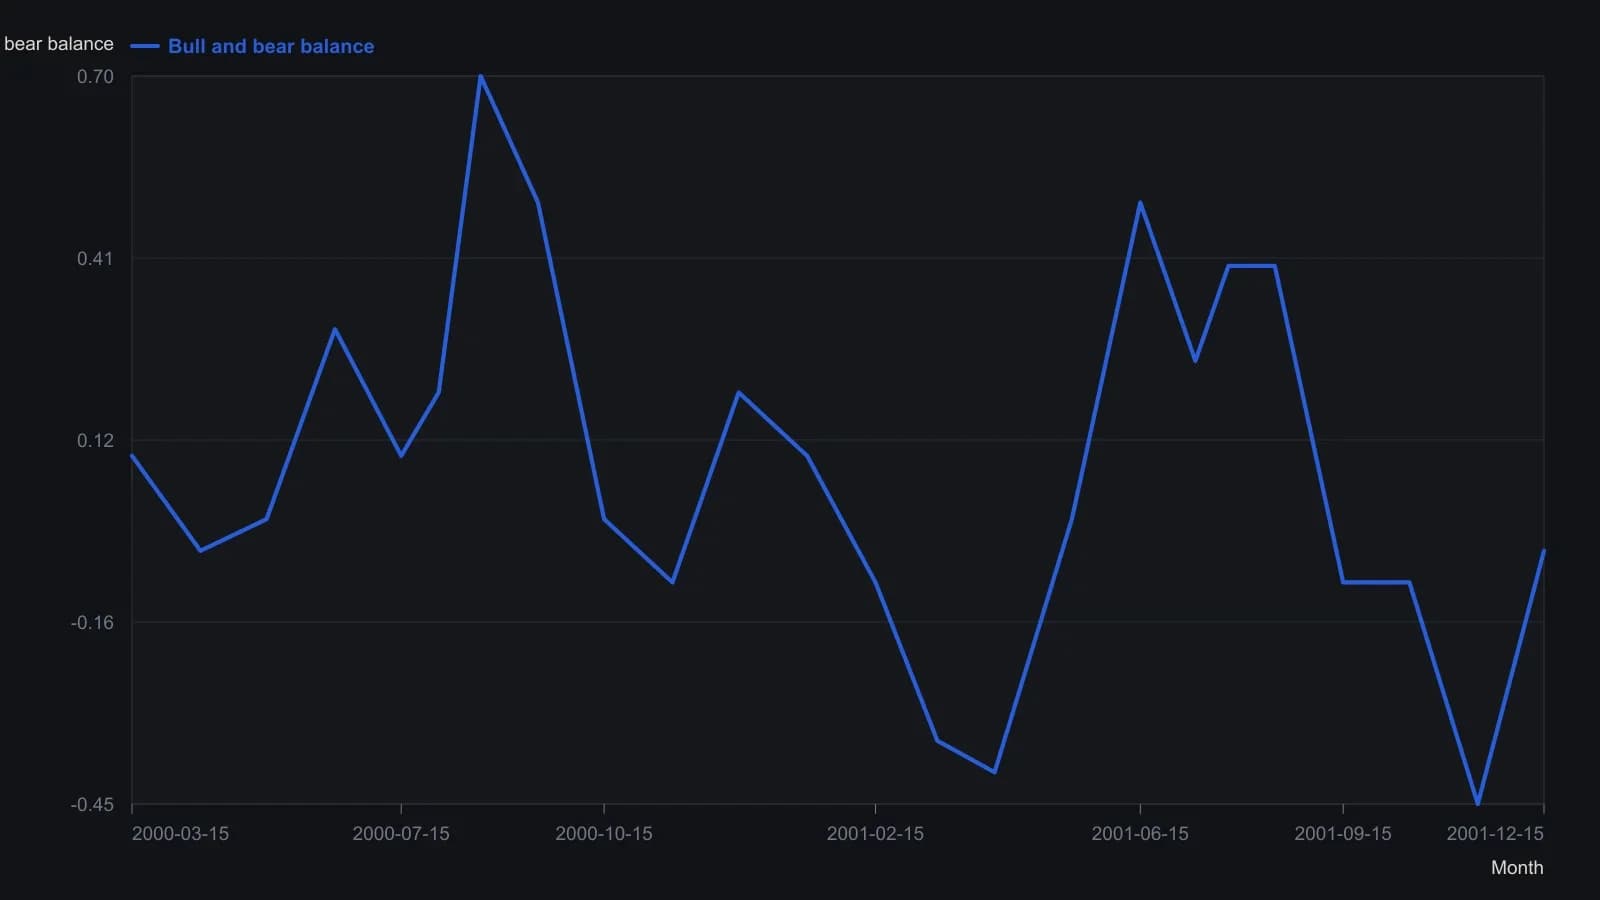
Digitized from the source histogram at mid-month marks plus visible turning points; rounded to 0.05 because the raster does not support finer precision.
All readings on this track · 32 readings
- 1989Volume confirmation windows and exponential average construction
- 1990Constructing stochastic %K and %D from range position
- 1990Build a weekly leading sector composite from scaled transports and financials
- 1990Constructing stochastic K and D lines and divergence cues
- 1993Relative strength index events depend on the chosen input combination
- 1995Constructing a dual-horizon force index
- 1996Building a range-normalized divergence index from relative strength index
- 1998Treat RSI as a testable filter rather than a trigger
- 1999Primary-cycle windows, then stochastic confirmation
- 1999Stochastic rules versus buy and hold
- 2001Constructing confirmation filters for RSI overbought and oversold extremes
- 2003Constructing divergence-equivalent relative strength index and stochastic oscillators
- 2003Reverse-engineered RSI as a next-close projection
- 2003Scoring open versus resolved relative strength divergences
- 2003Bull-and-bear-balance from OHLC bar patterns
- 2003Constructing bull and bear balance from session paths
- 2004Four-month rule: auto stocks as a market-regime warning
- 2004Constructing stochastic oscillator bands, crosses and divergence
- 2004Volume as an independent check on price oscillators
- 2004Simple dual confirmation for a short-horizon index-futures system
- 2005Confirm a stochastic divergence by reclaiming the first-swing bar
- 2005Weekly stochastic divergence and a long average on 2005 high-yield entrants
- 2005Predicted averages from related market baskets
- 2006Rank price-oscillator divergences, then filter by trend
- 2006Relative-spread-strength for cycle confirmation
- 2007Weekly breakout stretch and histogram divergence
- 2011A luxury-auction stock as a cross-market bubble warning
- 2014Running-percentile close divergences and trend filters
- 2015Rebuilding the relative strength index from close-to-average gaps
- 2016Constructing higher-high and lower-low stochastic pairs
- 2018Constructing composite relative-strength-index stochastics for reversal confirmation
- 2019Building a smoothed Stochastic oscillator of the Relative Strength Index for Price-indicator divergence checks