2015issue C0426-30
Rebuilding the relative strength index from close-to-average gaps
The slow relative strength index keeps a 0-100 relative-strength transform but replaces raw close-to-close change with the signed gap between the close and a short exponential moving average. The rebuilt oscillator is still read with overbought, oversold, centerline, and divergence grammar.
- The slow relative strength index applies the relative-strength transform to a ratio of averaged positive and negative gaps between the close and a short exponential moving average.
- Those gap series are seeded with a simple lookback mean and then updated with Wilder smoothing, with the oscillator pinned at 100 or 0 when one side of the lookback is empty.
- Default average and lookback lengths, and the conventional overbought and oversold bands, may be substituted to match a market or style.
- Centerline crosses, momentum-zone support and resistance, breakouts, and price-indicator divergences are used to classify continuation versus reversal hypotheses, and the archive treats those divergences as confirmation rather than standalone forecasts.
Signed gaps replace close-to-close change
The slow relative strength index is constructed as a 0-100 oscillator by applying the relative-strength transform SRSI = 100 - [100 / (1 + SRS)] to a ratio of averaged positive and negative close-to-average gaps.
Each period’s signed input is the gap between the closing price and a six-day exponential moving average of closes. The gap is recorded as a positive difference when the close is above the average and as a positive-valued negative difference when the close is below it. A close equal to the average contributes zero.
Wilder smoothing and the 0-100 scale
The positive and negative difference series are first averaged over 14 days and then updated with Wilder smoothing. Prior 14-day averages are multiplied by 13, the newest differences are added, and the sums are divided by 14.
Slow relative strength, or SRS, is the ratio of the smoothed average positive close-to-average gap to the smoothed average negative close-to-average gap. The slow relative strength index applies the relative-strength transform to that ratio.
If the average negative difference is zero, the oscillator is set to 100 because every lookback close was above the six-day average. If the average positive difference is zero, the oscillator is set to 0 because every lookback close was below that average.
Slow RSI (6,14) on the S&P 500, Aug–Oct 2000
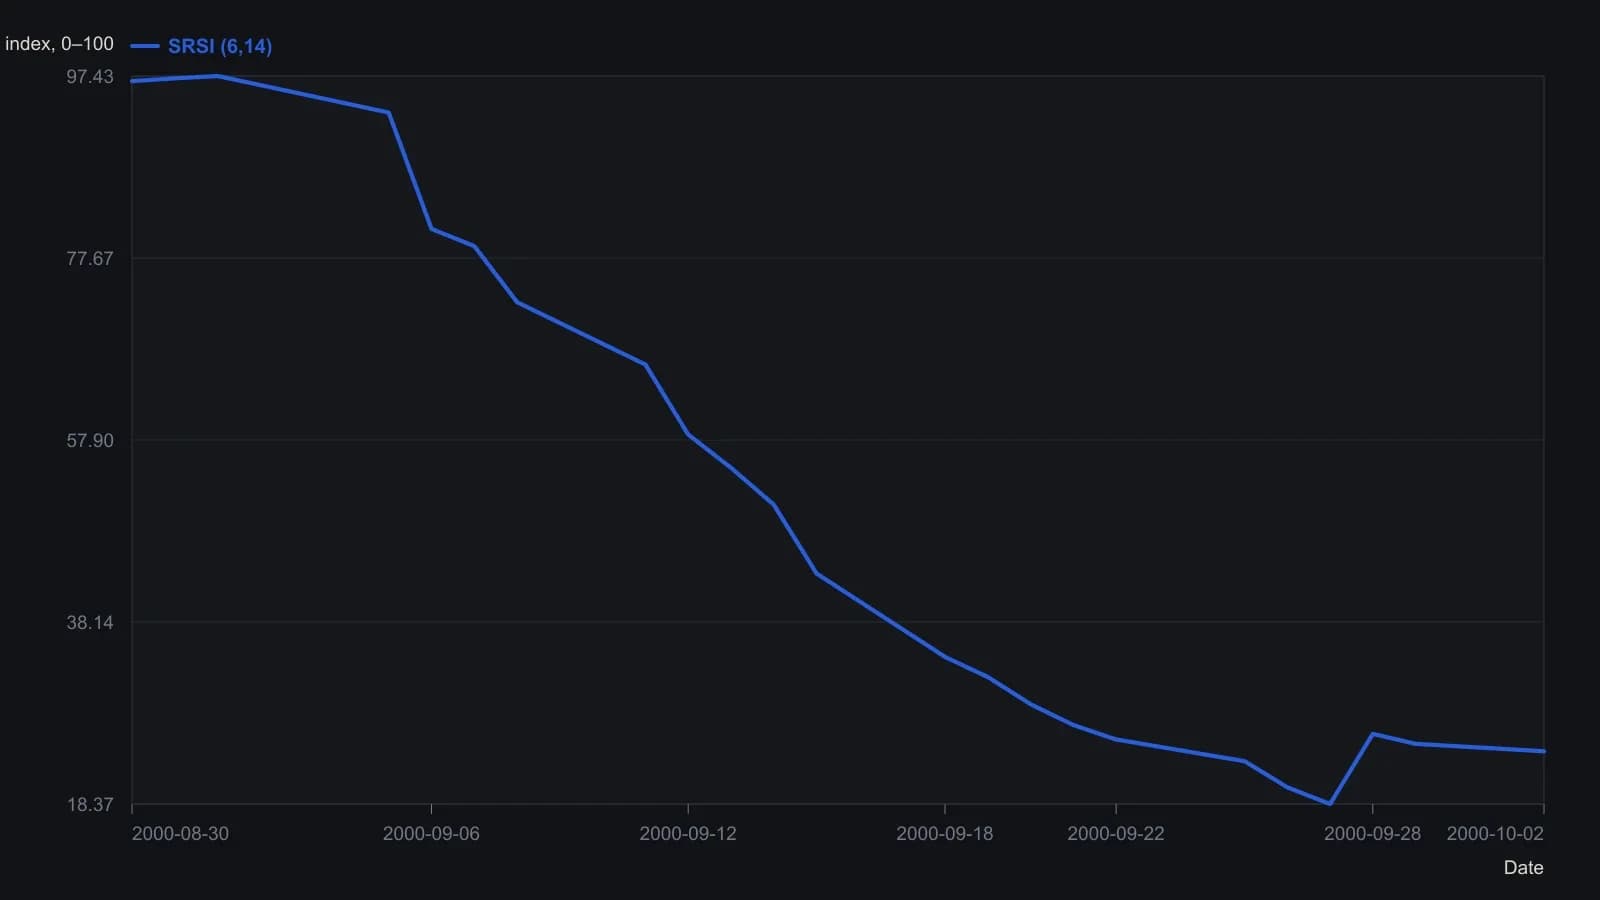
Defaults in the table are a 6-day EMA of the close and 14-period Wilder smoothing of the signed close-to-average gaps. SRSI is blank until that averaging window fills on 30 August 2000.
Overbought, oversold, and related cues
On a daily S&P 500 chart from March 1999 to May 2000, the six-and-14 slow oscillator produced stronger long-horizon momentum readings and extra overbought or oversold events relative to a 14-period relative strength index, while its short-horizon readings were weaker.
The same oscillator is also read through centerline crosses, momentum-zone support and resistance, breakouts, and price-indicator divergences to classify continuation versus reversal hypotheses. A centerline crossover is a signal formed when the oscillator crosses its midpoint. A momentum zone is an oscillator band used as support or resistance, such as a mid-range pocket that can hold or cap successive swings.
Price-indicator divergence as confirmation
In a 2007-2009 S&P 500 example, a late-2008 oversold reading and a later higher oscillator low against a lower price low formed a bullish divergence. That reading was treated as confirmed only after the oscillator cleared a 50-57 resistance zone and price cleared its own resistance.
The archive presents those divergences as usable buy and sell hypotheses that lose effectiveness in strong trends. They should be treated as confirmation alongside other indicators and price structure rather than as standalone forecasts.
All readings on this track · 32 readings
- 1989Volume confirmation windows and exponential average construction
- 1990Constructing stochastic %K and %D from range position
- 1990Build a weekly leading sector composite from scaled transports and financials
- 1990Constructing stochastic K and D lines and divergence cues
- 1993Relative strength index events depend on the chosen input combination
- 1995Constructing a dual-horizon force index
- 1996Building a range-normalized divergence index from relative strength index
- 1998Treat RSI as a testable filter rather than a trigger
- 1999Primary-cycle windows, then stochastic confirmation
- 1999Stochastic rules versus buy and hold
- 2001Constructing confirmation filters for RSI overbought and oversold extremes
- 2003Constructing divergence-equivalent relative strength index and stochastic oscillators
- 2003Reverse-engineered RSI as a next-close projection
- 2003Scoring open versus resolved relative strength divergences
- 2003Bull-and-bear-balance from OHLC bar patterns
- 2003Constructing bull and bear balance from session paths
- 2004Four-month rule: auto stocks as a market-regime warning
- 2004Constructing stochastic oscillator bands, crosses and divergence
- 2004Volume as an independent check on price oscillators
- 2004Simple dual confirmation for a short-horizon index-futures system
- 2005Confirm a stochastic divergence by reclaiming the first-swing bar
- 2005Weekly stochastic divergence and a long average on 2005 high-yield entrants
- 2005Predicted averages from related market baskets
- 2006Rank price-oscillator divergences, then filter by trend
- 2006Relative-spread-strength for cycle confirmation
- 2007Weekly breakout stretch and histogram divergence
- 2011A luxury-auction stock as a cross-market bubble warning
- 2014Running-percentile close divergences and trend filters
- 2015Rebuilding the relative strength index from close-to-average gaps
- 2016Constructing higher-high and lower-low stochastic pairs
- 2018Constructing composite relative-strength-index stochastics for reversal confirmation
- 2019Building a smoothed Stochastic oscillator of the Relative Strength Index for Price-indicator divergence checks