2011issue C1156-58
A luxury-auction stock as a cross-market bubble warning
A luxury-auction-house stock peaked before or with major equity indexes, then fell further than the funded market. The editorial sequence is to identify which asset class is paying for extravagant art bids, then check whether Relative Strength Index and price-indicator divergence on the auction proxy are already fading.
- A 1989 luxury-auction-house share peak preceded the Nikkei 225 all-time high, and the stock had already fallen more than 30 percent by the time that index topped.
- The same stock peaked in April 1999, eleven months before the S&P 500 and Nasdaq Composite, then peaked again on 11 October 2007 as the S&P 500 was topping.
- Seven-period Relative Strength Index showed negative price-indicator divergence well ahead of later auction-house price peaks, including a fresh divergence that began nearly a year before the April 2011 high.
- The archive teaching point is to identify which stock, real-estate, or commodity market is funding extravagant art purchases as a candidate bubble.
A proxy between art bids and funded markets
This case uses three historical peaks in a luxury-auction-house stock, plus a later Relative Strength Index sequence, to teach a cross-market reading of extravagant art bids.
Editorial framing: treat the auction-house stock as a warning proxy. First locate which asset class is funding the bids. Then ask whether the proxy's relative strength and price-indicator divergence are already fading before the funded market itself rolls over.
The 1989 Japan sequence
A 1989 luxury-auction-house share peak preceded the Nikkei 225 all-time high. The auction-house stock had already fallen more than 30 percent by the time that equity index topped.
After the Japanese equity peak, a Japanese buyer paid 82.5 million dollars for a van Gogh portrait in May 1990. That sale followed an earlier 39.9 million dollar van Gogh still-life sale in March 1987, a price more than three times the prior painting-price record of 10.4 million dollars.
Editorial note: headline art prices can still print after the funding equity market has peaked. In this sequence the auction-house share price weakened first.
Later peaks against U.S. equity indexes
The same auction-house stock later peaked in April 1999, eleven months before the S&P 500 and Nasdaq Composite. It peaked again on 11 October 2007 as the S&P 500 was topping and was cut nearly in half a little over three weeks later.
From the October 2007 high into the subsequent trough, the auction-house stock declined more than 88 percent, compared with a 57 percent maximum drop in the S&P 500 over a similar period.
Relative strength versus an equity proxy
From June 1997 to the April 1999 peak, the auction-house stock rose 160 percent versus less than half that gain in an S&P 500 exchange-traded fund proxy. In 2006-07 it rose more than 240 percent versus a much smaller move in the same proxy.
Editorial reading: Intermarket analysis here is a comparison of pace, not a claim that art causes equity tops. The question is whether luxury bids are being funded by an equity advance that the auction proxy has already outpaced.
Sotheby's versus SPY weekly performance from mid-1997
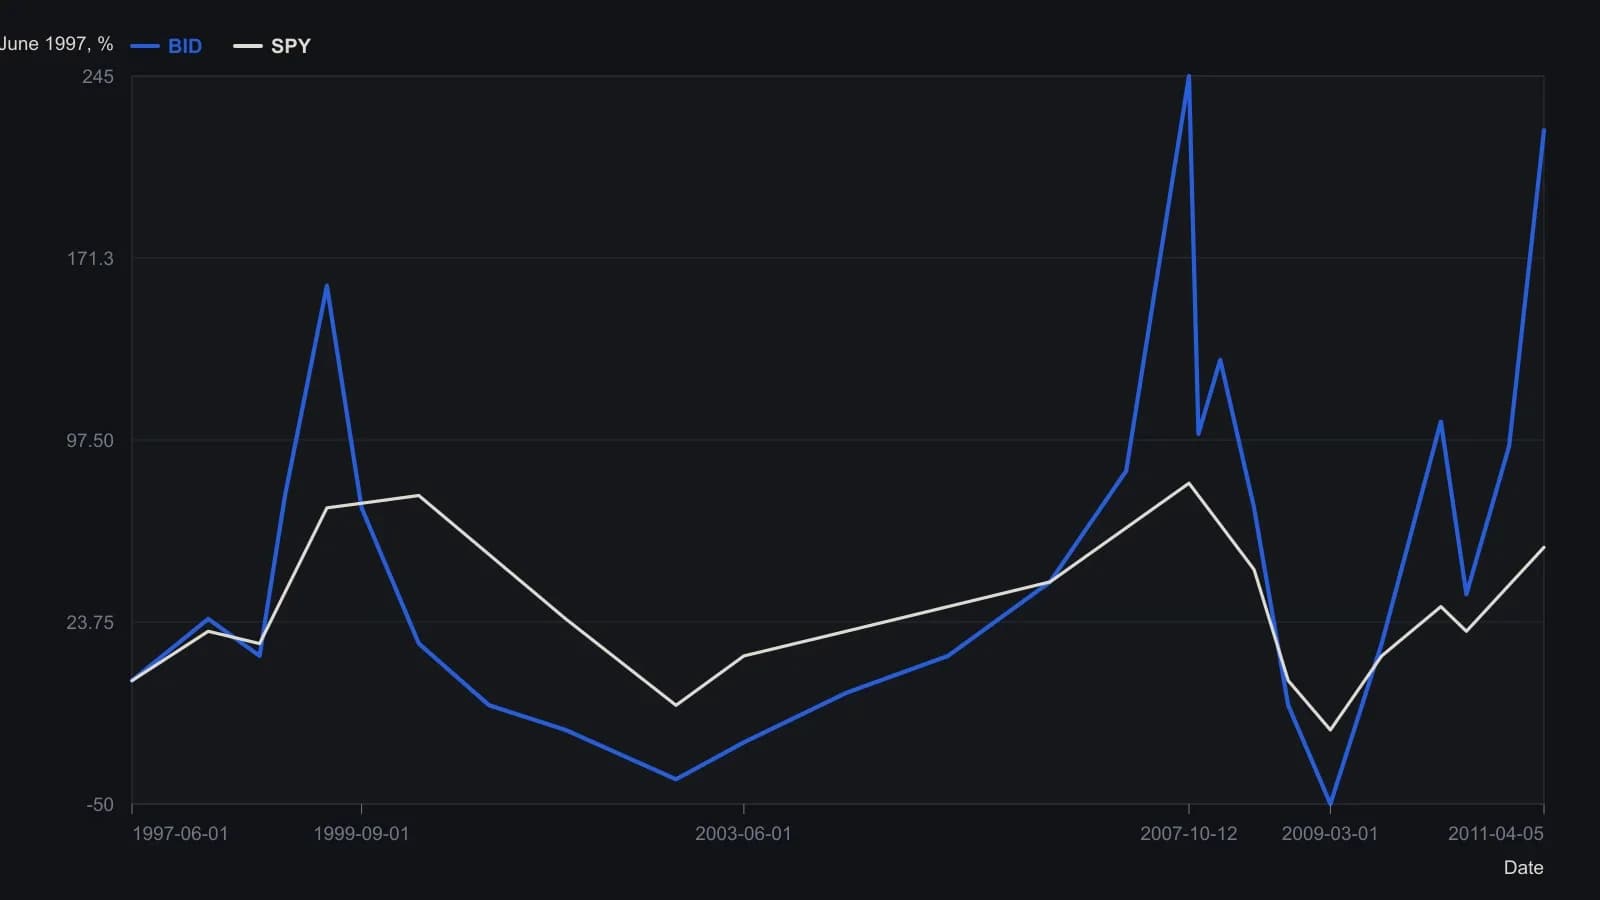
Cumulative percent from June 1997 on weekly VectorVest bars. Scale on the source plot runs from -60 to 260. Intermediate points are coarse raster reads; only the printed endpoints and the April 1999 / October 2007 / April 2011 anchors are stated in the article.
Relative Strength Index and price-indicator divergence
Seven-period Relative Strength Index on the auction-house stock showed negative divergence well ahead of later price peaks, including a fresh negative divergence that began nearly a year before the April 2011 high.
Editorial reading: the oscillator sequence is a second check after the funding-market map. A later price high in the auction proxy with fading Relative Strength Index is the condition to study, not a timed exit.
Identify the funding market
A May 2011 interview described recent art-auction bidding as tepid and warned of a downtrend in art prices. The teaching point was to identify which stock, real-estate, or commodity market was funding extravagant art purchases as a candidate bubble.
All readings on this track · 32 readings
- 1989Volume confirmation windows and exponential average construction
- 1990Constructing stochastic %K and %D from range position
- 1990Build a weekly leading sector composite from scaled transports and financials
- 1990Constructing stochastic K and D lines and divergence cues
- 1993Relative strength index events depend on the chosen input combination
- 1995Constructing a dual-horizon force index
- 1996Building a range-normalized divergence index from relative strength index
- 1998Treat RSI as a testable filter rather than a trigger
- 1999Primary-cycle windows, then stochastic confirmation
- 1999Stochastic rules versus buy and hold
- 2001Constructing confirmation filters for RSI overbought and oversold extremes
- 2003Constructing divergence-equivalent relative strength index and stochastic oscillators
- 2003Reverse-engineered RSI as a next-close projection
- 2003Scoring open versus resolved relative strength divergences
- 2003Bull-and-bear-balance from OHLC bar patterns
- 2003Constructing bull and bear balance from session paths
- 2004Four-month rule: auto stocks as a market-regime warning
- 2004Constructing stochastic oscillator bands, crosses and divergence
- 2004Volume as an independent check on price oscillators
- 2004Simple dual confirmation for a short-horizon index-futures system
- 2005Confirm a stochastic divergence by reclaiming the first-swing bar
- 2005Weekly stochastic divergence and a long average on 2005 high-yield entrants
- 2005Predicted averages from related market baskets
- 2006Rank price-oscillator divergences, then filter by trend
- 2006Relative-spread-strength for cycle confirmation
- 2007Weekly breakout stretch and histogram divergence
- 2011A luxury-auction stock as a cross-market bubble warning
- 2014Running-percentile close divergences and trend filters
- 2015Rebuilding the relative strength index from close-to-average gaps
- 2016Constructing higher-high and lower-low stochastic pairs
- 2018Constructing composite relative-strength-index stochastics for reversal confirmation
- 2019Building a smoothed Stochastic oscillator of the Relative Strength Index for Price-indicator divergence checks