2014issue C0524-26
Running-percentile close divergences and trend filters
Editorial three-gate reading: treat a close-location-cluster as an early adaptive hypothesis, let a separate trend-filter assign each print a continuation or fade role, and convert that known earliness into a trailing-entry-stop instead of an immediate fill.
- A close-location-cluster is a run of large sessions that break the ordinary pairing of a wide move with a close near that extreme, tallied as a running sum and ranked with a running-percentile so the bull and bear readings adapt.
- A separate trend-filter labels each divergence as with-trend or countertrend before any entry rule, and a later reaffirmation of a first extreme is treated as the more useful print.
- Prints are characterized as arriving early far more often than late or on time, so a trailing-entry-stop is preferred to an immediate market order.
- Horizontal ranges after a prior directional leg are useful search zones, and the readings are described as more accurate while volatility is still increasing rather than merely elevated.
Clustered close mismatches as a hypothesis
The archive workflow separates extrinsic from intrinsic divergence. It treats clustered exceptions to the usual close-near-extreme habit of large sessions as a running sum, and that sum underpins the bull and bear readings.
Under ordinary conditions a weak close near the session low accompanies a relatively large decline, and a strong close near the session high accompanies a relatively large advance. Repeated breaks of those pairings are read as a potential top or bottom. That run of failed pairings is the close-location-cluster.
Strong directional sessions are scored against their own history with a running-percentile rather than an average. The archive presents that rank as what makes the bull and bear readings adaptive compared with other divergence tools.
Assign a continuation or fade role
The same bull and bear readings are used both to mark extremes and to mark temporary reversals. A stronger existing trend is described as making an opposing signal more informative as a reversal hypothesis. Divergence is not reserved for fading the tape: the same readings are also used to seek entries along an existing trend, including a trend visible only on a higher time frame.
During a strong trend, opposing prints can be stretched and lose much of their accuracy even when they still precede a turn. A separate trend-filter then labels each divergence as countertrend or not, and a later reaffirmation of a first extreme is treated as the more useful print.
Editorial reading: a relative-strength-index lookback on ordered price can sit beside that filter as a forecast-style baseline, so the explicit quantitative reading can be compared with a later out-of-sample outcome. That oscillator is an editorial companion, not a replacement for the trend-filter label.
A trailing stop, not an immediate fill
The signals are characterized as arriving early far more often than late or on time, which is why a trailing-entry-stop is preferred to an immediate market order. When the same readings are used to seek a with-trend entry after a late-stage horizontal print, a delayed technical stop means the print is filled only if a breakout actually occurs.
Search zones and uneven quality
Horizontal ranges after a prior directional leg are treated as useful search zones. The preceding up or down phase, together with whether volatility in the range is elevated, is used to distinguish accumulation from distribution.
The readings are said to become more accurate while volatility is still increasing rather than merely elevated, and historical tests are described as favoring higher time frames when that rising-volatility condition holds. An earlier accurate print on the same name is treated as a possible precursor of later reliability, so signal quality is allowed to vary by equity rather than assumed to be uniform.
Google daily price with 50- and 200-day averages, May 2012–May 2013
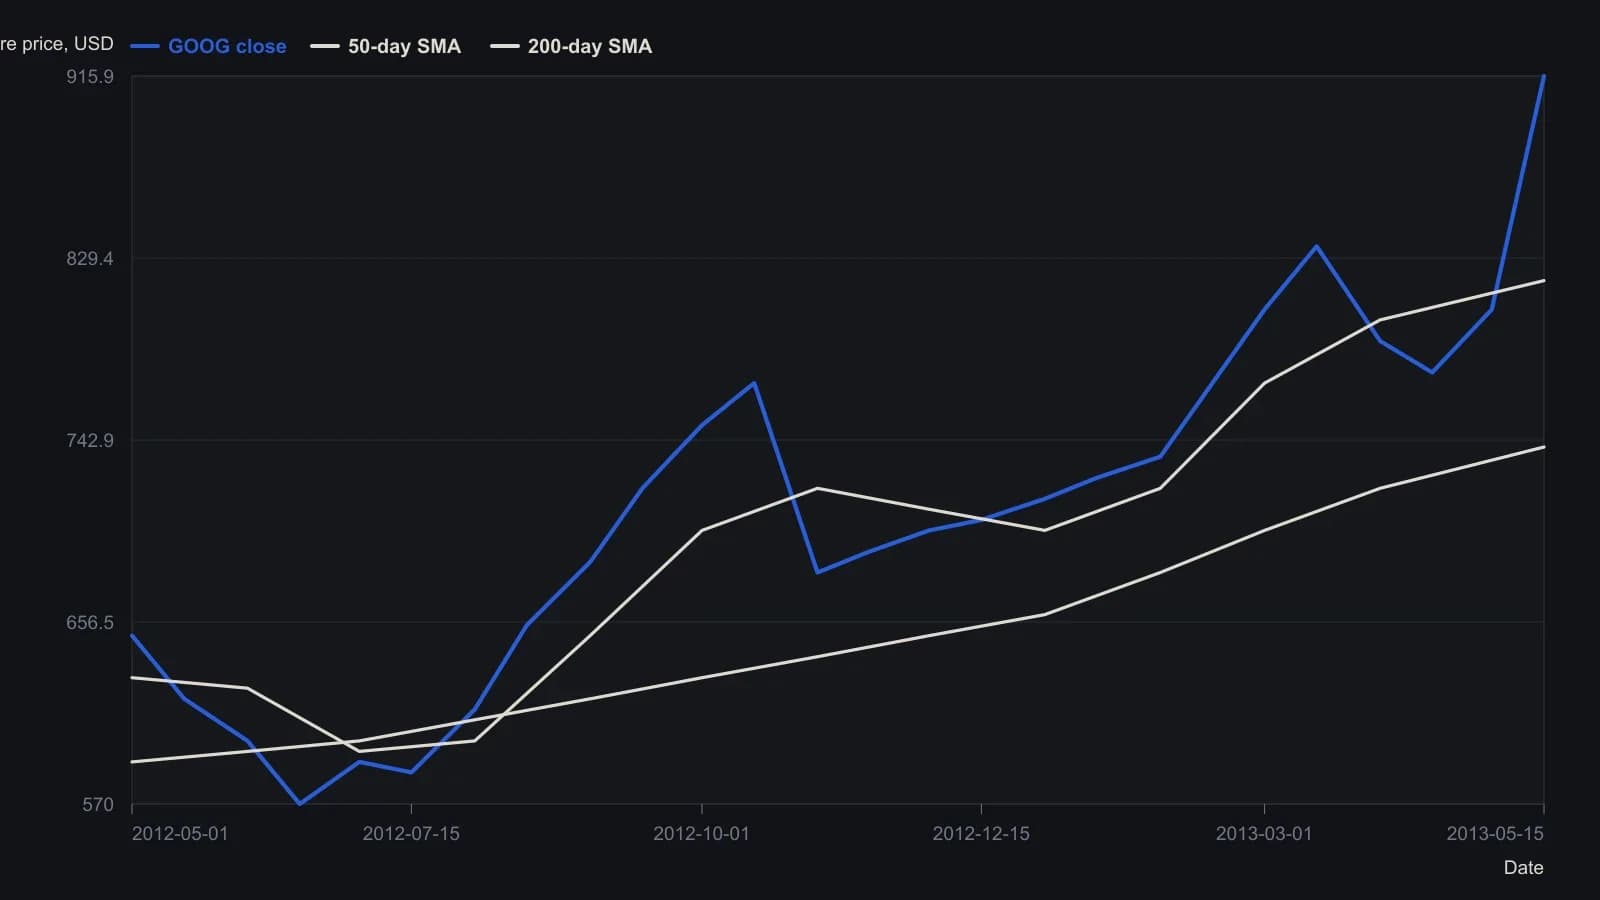
Intermediate prices are digitized from the candlestick pane to about 10 dollars and sampled twice a month to stay inside the point limit. The 15 May 2013 header fixes the last close at 915.89, the 50-day average at 818.69 and the 200-day average at 739.61. Chartmill bull, bear and trend panes use other scales and are not mixed in.
All readings on this track · 32 readings
- 1989Volume confirmation windows and exponential average construction
- 1990Constructing stochastic %K and %D from range position
- 1990Build a weekly leading sector composite from scaled transports and financials
- 1990Constructing stochastic K and D lines and divergence cues
- 1993Relative strength index events depend on the chosen input combination
- 1995Constructing a dual-horizon force index
- 1996Building a range-normalized divergence index from relative strength index
- 1998Treat RSI as a testable filter rather than a trigger
- 1999Primary-cycle windows, then stochastic confirmation
- 1999Stochastic rules versus buy and hold
- 2001Constructing confirmation filters for RSI overbought and oversold extremes
- 2003Constructing divergence-equivalent relative strength index and stochastic oscillators
- 2003Reverse-engineered RSI as a next-close projection
- 2003Scoring open versus resolved relative strength divergences
- 2003Bull-and-bear-balance from OHLC bar patterns
- 2003Constructing bull and bear balance from session paths
- 2004Four-month rule: auto stocks as a market-regime warning
- 2004Constructing stochastic oscillator bands, crosses and divergence
- 2004Volume as an independent check on price oscillators
- 2004Simple dual confirmation for a short-horizon index-futures system
- 2005Confirm a stochastic divergence by reclaiming the first-swing bar
- 2005Weekly stochastic divergence and a long average on 2005 high-yield entrants
- 2005Predicted averages from related market baskets
- 2006Rank price-oscillator divergences, then filter by trend
- 2006Relative-spread-strength for cycle confirmation
- 2007Weekly breakout stretch and histogram divergence
- 2011A luxury-auction stock as a cross-market bubble warning
- 2014Running-percentile close divergences and trend filters
- 2015Rebuilding the relative strength index from close-to-average gaps
- 2016Constructing higher-high and lower-low stochastic pairs
- 2018Constructing composite relative-strength-index stochastics for reversal confirmation
- 2019Building a smoothed Stochastic oscillator of the Relative Strength Index for Price-indicator divergence checks