2005issue C051-3
Weekly stochastic divergence and a long average on 2005 high-yield entrants
The 2005 refresh of a high-yield industrial ranking added a telecommunications industrial and a pharmaceutical industrial. Weekly charts of those two names record a 7(4).10 stochastic oscillator, price-indicator divergences, a 50-week exponential moving average test, and a heavy-volume selling climax. TradersWeek treats the refresh as an editorial workshop on whether those chart conditions support or contradict the mechanical listing before the next 365-day hold.
- The high-yield industrial ranking is a once-a-year selection of the ten highest-yielding Dow industrials, held in equal size for any consecutive 365-day span, and it does not require continuous market watching, balance-sheet work, or technical-pattern rules.
- After those ten names are identified, the price-filtered subset keeps only the five lowest-priced names for the hold. The calendar year is not required as the start and end of the window.
- Two names left the 2004 high-yield ten and two entered for 2005. The incoming telecommunications industrial and pharmaceutical industrial are the names then examined on weekly charts that both display a 7(4).10 stochastic oscillator.
- The telecommunications weekly chart shows a negative autumn 2004 stochastic divergence and a test of a 50-week exponential moving average near the 39 level. The pharmaceutical weekly chart shows a positive divergence between the August 2004 and December 2004 lows, paired with a December 17 session of more than 456 million shares described as a selling climax.
A once-a-year high-yield ranking
The high-yield industrial ranking is framed as a once-a-year selection. It does not require continuous market watching, balance-sheet work, or technical-pattern rules. The sort keeps the ten highest-yielding Dow industrials in equal size for the hold.
After those ten names are identified, the price-filtered subset keeps only the five lowest-priced names. The holding window is any consecutive 365-day span. The calendar year is not required as the start and end.
2004 Dogs of the Dow capital returns by ticker
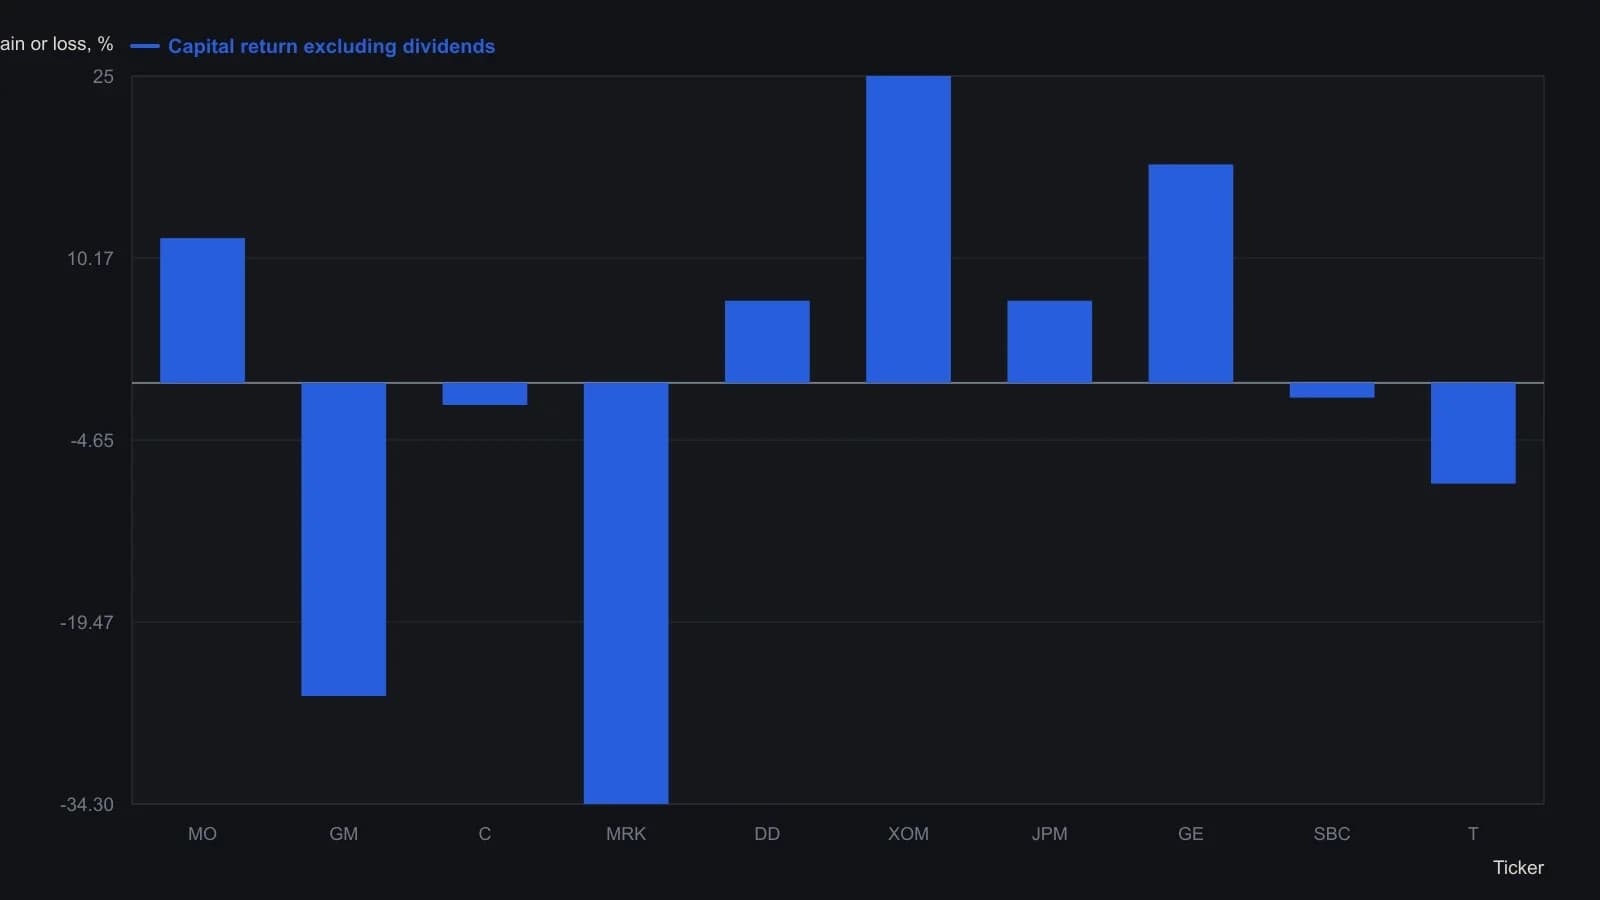
The source table excludes dividends. GM and Merck still paid 4.99% and 4.73% yields that year, which are not in these bars.
Two names enter for 2005
Two names left the 2004 high-yield ten and two entered for 2005. The incoming pair is a telecommunications industrial and a pharmaceutical industrial. Those two names are the ones then examined on weekly charts.
The weekly telecommunications chart
On the weekly telecommunications chart, a negative price-indicator divergence is identified in autumn 2004 against the advance that began from the October 2003 lows. The stochastic oscillator is the momentum series in that comparison. The divergence is described as confirmed even though the October 2004 correction low had not been broken.
The same weekly pullback is described as testing a 50-week exponential moving average near the 39 level for support. The exponential moving average is used here as a support reference on the weekly span, not as a substitute for the yield ranking.
The weekly pharmaceutical chart
On the weekly pharmaceutical chart, a positive price-indicator divergence is identified between the August 2004 lows and the December 2004 lows. Price and the oscillator print opposing extremes at those lows.
That positive divergence is paired with a December 17 volume event of more than 456 million shares. The session is described as the heaviest in more than ten years and as a selling climax: a session of exceptional volume after a long decline, read as possible selling exhaustion when it coincides with a positive oscillator divergence.
The shared weekly oscillator
Both weekly case charts display a stochastic oscillator specified as 7(4).10. The stochastic oscillator is a bounded momentum model that places the close inside a defined lookback range. Price-indicator divergence remains a chart condition, framed as a falsifiable signal rather than a completed forecast.
An editorial reading of the overlay
Editorial reading: the archive presents the ranking as a mechanical hold that does not depend on technical-pattern rules. The weekly charts are a separate inspection of the two incoming names. TradersWeek does not treat the autumn 2004 negative divergence, the 50-week average test, or the December selling climax as a verdict on the listing. They are case observations that can support or contradict the next 365-day hold only as a labelled workshop question.
All readings on this track · 32 readings
- 1989Volume confirmation windows and exponential average construction
- 1990Constructing stochastic %K and %D from range position
- 1990Build a weekly leading sector composite from scaled transports and financials
- 1990Constructing stochastic K and D lines and divergence cues
- 1993Relative strength index events depend on the chosen input combination
- 1995Constructing a dual-horizon force index
- 1996Building a range-normalized divergence index from relative strength index
- 1998Treat RSI as a testable filter rather than a trigger
- 1999Primary-cycle windows, then stochastic confirmation
- 1999Stochastic rules versus buy and hold
- 2001Constructing confirmation filters for RSI overbought and oversold extremes
- 2003Constructing divergence-equivalent relative strength index and stochastic oscillators
- 2003Reverse-engineered RSI as a next-close projection
- 2003Scoring open versus resolved relative strength divergences
- 2003Bull-and-bear-balance from OHLC bar patterns
- 2003Constructing bull and bear balance from session paths
- 2004Four-month rule: auto stocks as a market-regime warning
- 2004Constructing stochastic oscillator bands, crosses and divergence
- 2004Volume as an independent check on price oscillators
- 2004Simple dual confirmation for a short-horizon index-futures system
- 2005Confirm a stochastic divergence by reclaiming the first-swing bar
- 2005Weekly stochastic divergence and a long average on 2005 high-yield entrants
- 2005Predicted averages from related market baskets
- 2006Rank price-oscillator divergences, then filter by trend
- 2006Relative-spread-strength for cycle confirmation
- 2007Weekly breakout stretch and histogram divergence
- 2011A luxury-auction stock as a cross-market bubble warning
- 2014Running-percentile close divergences and trend filters
- 2015Rebuilding the relative strength index from close-to-average gaps
- 2016Constructing higher-high and lower-low stochastic pairs
- 2018Constructing composite relative-strength-index stochastics for reversal confirmation
- 2019Building a smoothed Stochastic oscillator of the Relative Strength Index for Price-indicator divergence checks