2001issue C011-4
Constructing confirmation filters for RSI overbought and oversold extremes
This editorial lesson treats overbought and oversold bands on the relative strength index as a two-gate construction. First draw a bounded extreme from a defined lookback. Then withhold any trade hypothesis until the oscillator recrosses toward equilibrium and price structure confirms. Price-indicator divergence is a second-layer check, not a stand-alone reversal switch.
- Overbought and oversold readings are constructed extremes that an oscillator tends to traverse; they raise the chance of a pause or turn without proving that price has reversed.
- A stricter filter waits until the oscillator recrosses its boundary toward equilibrium rather than acting at first contact with the extreme.
- A reversal in the momentum series is only a reversal of velocity; price-confirmation in the price series is still required.
- Price-indicator divergence can strengthen a later extreme only when it accompanies that confirmation, and it is not a stand-alone reversal switch.
Momentum as an oscillator class
Momentum is an umbrella class of oscillators, including rate of change, relative strength index, moving-average convergence/divergence, and stochastics. These series share broad interpretation principles while they differ in construction attributes.
Oscillators built on longer sampling intervals carry more interpretive weight than those with a five- or ten-day span, because reversing a longer-term trend requires a larger shift in collective psychology.
General Motors monthly share price
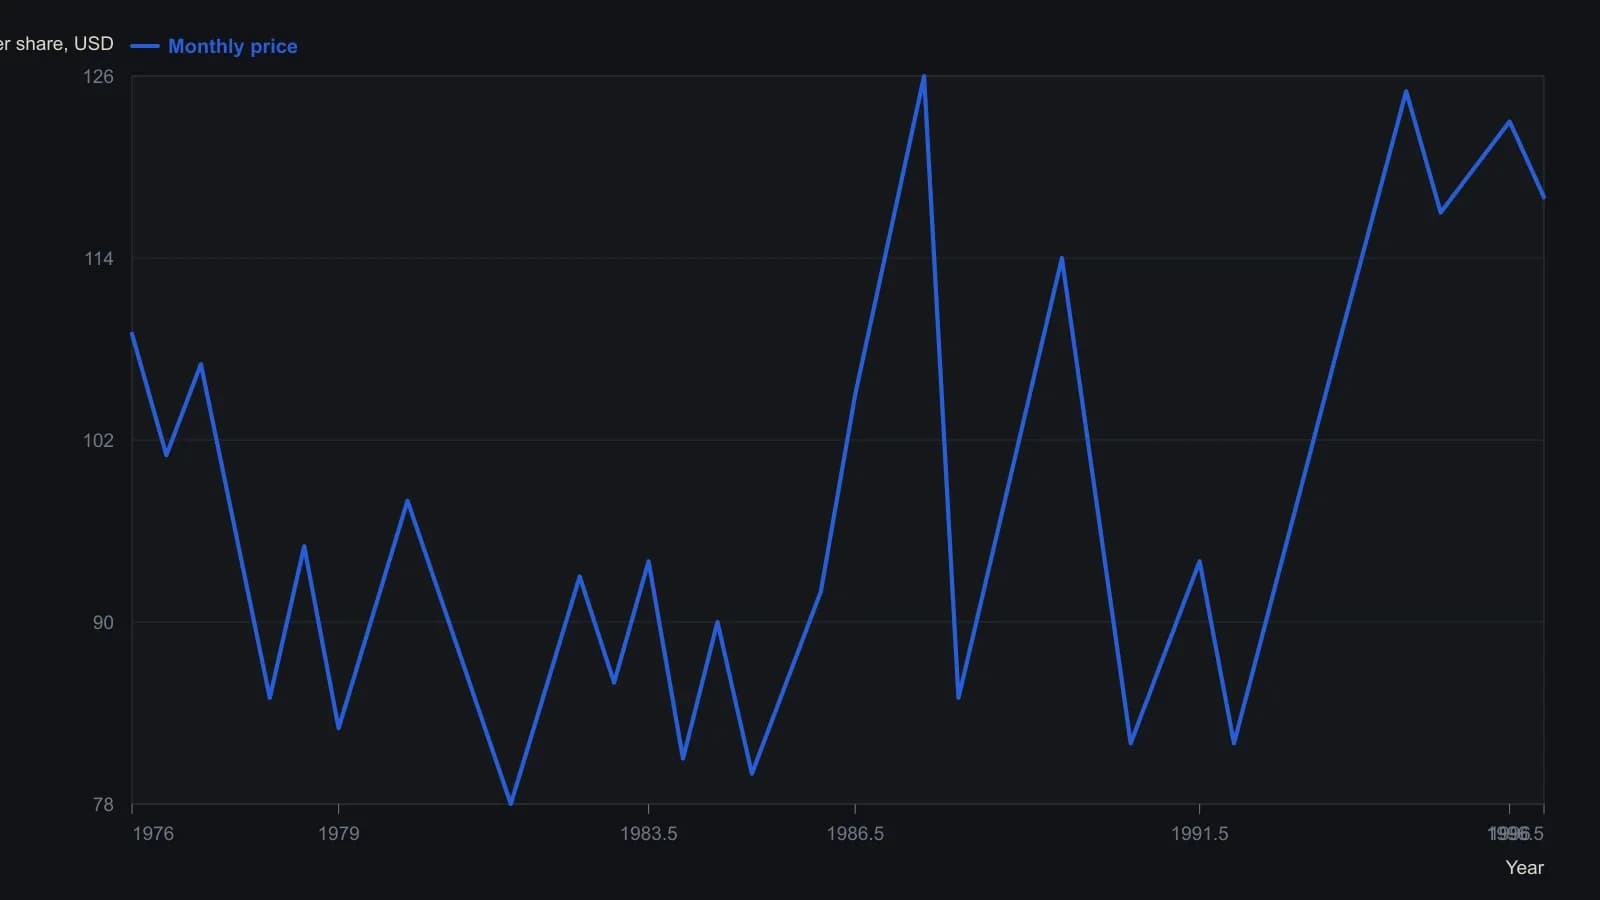
Figure 2 does not publish a table or name the lower-pane oscillator, so only the monthly price line is reconstructed. Years between the two printed marks are interpolated; readings are approximate to the nearest dollar.
The first gate: constructed extremes
Overbought and oversold readings are constructed extremes that an oscillator tends to traverse. They mark conditions where reversal odds rise rather than guaranteeing a price turn.
The relative strength index is a bounded momentum oscillator built from ordered price observations over a defined lookback. Overbought is its constructed upper extreme. Oversold is its constructed lower extreme. Equilibrium is the mid-range between those extremes.
The second gate: recross and price-confirmation
A stricter filter waits until the oscillator recrosses its overbought or oversold boundary on the way back toward equilibrium rather than acting at first contact with the extreme.
A reversal in the momentum series is only a reversal of velocity. A completed signal still requires a subsequent reversal in the price series itself. That later break or reversal is price-confirmation.
A 14-period relative-strength-index extreme remains unconfirmed until later price movement agrees. A single oscillator alert is treated as insufficient evidence of a trend change. A consensus of confirming series is required because any isolated indicator can fail.
Divergence as a second-layer check
Overbought and oversold conditions, together with price-indicator divergence, belong to the momentum-characteristic category of interpretation, separate from trendline and moving-average techniques applied to the oscillator.
Divergence is a chart condition in which price structure and a momentum series fail to confirm each other. It is usable only as a falsifiable signal after later price action agrees. A later extreme can be strengthened when price-indicator divergence accompanies that confirmation.
Editorial reading: do not treat divergence as a stand-alone reversal switch. Apply it only after the recross toward equilibrium and price-confirmation have already been required.
All readings on this track · 32 readings
- 1989Volume confirmation windows and exponential average construction
- 1990Constructing stochastic %K and %D from range position
- 1990Build a weekly leading sector composite from scaled transports and financials
- 1990Constructing stochastic K and D lines and divergence cues
- 1993Relative strength index events depend on the chosen input combination
- 1995Constructing a dual-horizon force index
- 1996Building a range-normalized divergence index from relative strength index
- 1998Treat RSI as a testable filter rather than a trigger
- 1999Primary-cycle windows, then stochastic confirmation
- 1999Stochastic rules versus buy and hold
- 2001Constructing confirmation filters for RSI overbought and oversold extremes
- 2003Constructing divergence-equivalent relative strength index and stochastic oscillators
- 2003Reverse-engineered RSI as a next-close projection
- 2003Scoring open versus resolved relative strength divergences
- 2003Bull-and-bear-balance from OHLC bar patterns
- 2003Constructing bull and bear balance from session paths
- 2004Four-month rule: auto stocks as a market-regime warning
- 2004Constructing stochastic oscillator bands, crosses and divergence
- 2004Volume as an independent check on price oscillators
- 2004Simple dual confirmation for a short-horizon index-futures system
- 2005Confirm a stochastic divergence by reclaiming the first-swing bar
- 2005Weekly stochastic divergence and a long average on 2005 high-yield entrants
- 2005Predicted averages from related market baskets
- 2006Rank price-oscillator divergences, then filter by trend
- 2006Relative-spread-strength for cycle confirmation
- 2007Weekly breakout stretch and histogram divergence
- 2011A luxury-auction stock as a cross-market bubble warning
- 2014Running-percentile close divergences and trend filters
- 2015Rebuilding the relative strength index from close-to-average gaps
- 2016Constructing higher-high and lower-low stochastic pairs
- 2018Constructing composite relative-strength-index stochastics for reversal confirmation
- 2019Building a smoothed Stochastic oscillator of the Relative Strength Index for Price-indicator divergence checks