2019issue C0250-57
Building a smoothed Stochastic oscillator of the Relative Strength Index for Price-indicator divergence checks
Assemble a two-stage oscillator by computing the Relative Strength Index first, then a smoothed Stochastic oscillator of that series, so a Price-indicator divergence can be tested as a defined setup rather than a visual impression.
- The featured construction applies a Stochastic oscillator to Relative Strength Index values rather than to raw price, then adds extra smoothing on the resulting range terms.
- A demonstration setting uses Relative Strength Index length 13, stochastic lookback 5, stochastic average length 8, and reference levels at 80 and 20 on a 0 to 100 scale.
- The intended reading is confirmation of price reversals from Price-indicator divergence, not from the oscillator reading alone.
- One example short setup combines a cross under 70 with a negative divergence on the two prior oscillator peaks versus the matching price highs, and the example exit is a fixed bar count.
A Stochastic oscillator of Relative Strength Index, not of price
The featured construction applies a Stochastic oscillator calculation to Relative Strength Index values rather than to raw price, then adds extra smoothing on the resulting range terms.
Editorial note: TradersWeek presents this sequence so a mismatch between price and the oscillator can be written as a specified condition, not left as a visual impression.
How one published implementation is assembled
One published implementation first computes the Relative Strength Index of the close. It then takes the lookback lowest and highest of that Relative Strength Index series. It averages the Relative Strength Index minus lowest and highest minus lowest terms, then scales the ratio to a 0 to 100 style oscillator.
Demonstration lengths and reference bands
A demonstration indicator in that implementation uses Relative Strength Index length 13, stochastic lookback 5, stochastic average length 8, and reference levels at 80 and 20.
The same construction is described as oscillating between 0 and 100, with the 80 and 20 levels treated as overbought and oversold reference bands.
Reading Price-indicator divergence rather than the oscillator alone
The intended reading is confirmation of price reversals from divergences between price and the oscillator, not from the oscillator reading alone.
An example short rule and a time-based exit
One example strategy treats a short setup as the oscillator crossing under 70 together with a negative Price-indicator divergence defined on the two prior oscillator peaks versus the corresponding price highs.
That example exit is time-based rather than indicator-based. The short is closed after a fixed bar count from entry.
A spreadsheet restatement of the same computation
An Excel reconstruction states that the same computation can be expressed as 13 formula columns on a price chart and another 13 on a renko chart, with 20 and 80 levels plotted as overlays.
SVEStochRSI on daily QQQ, February–October 2018
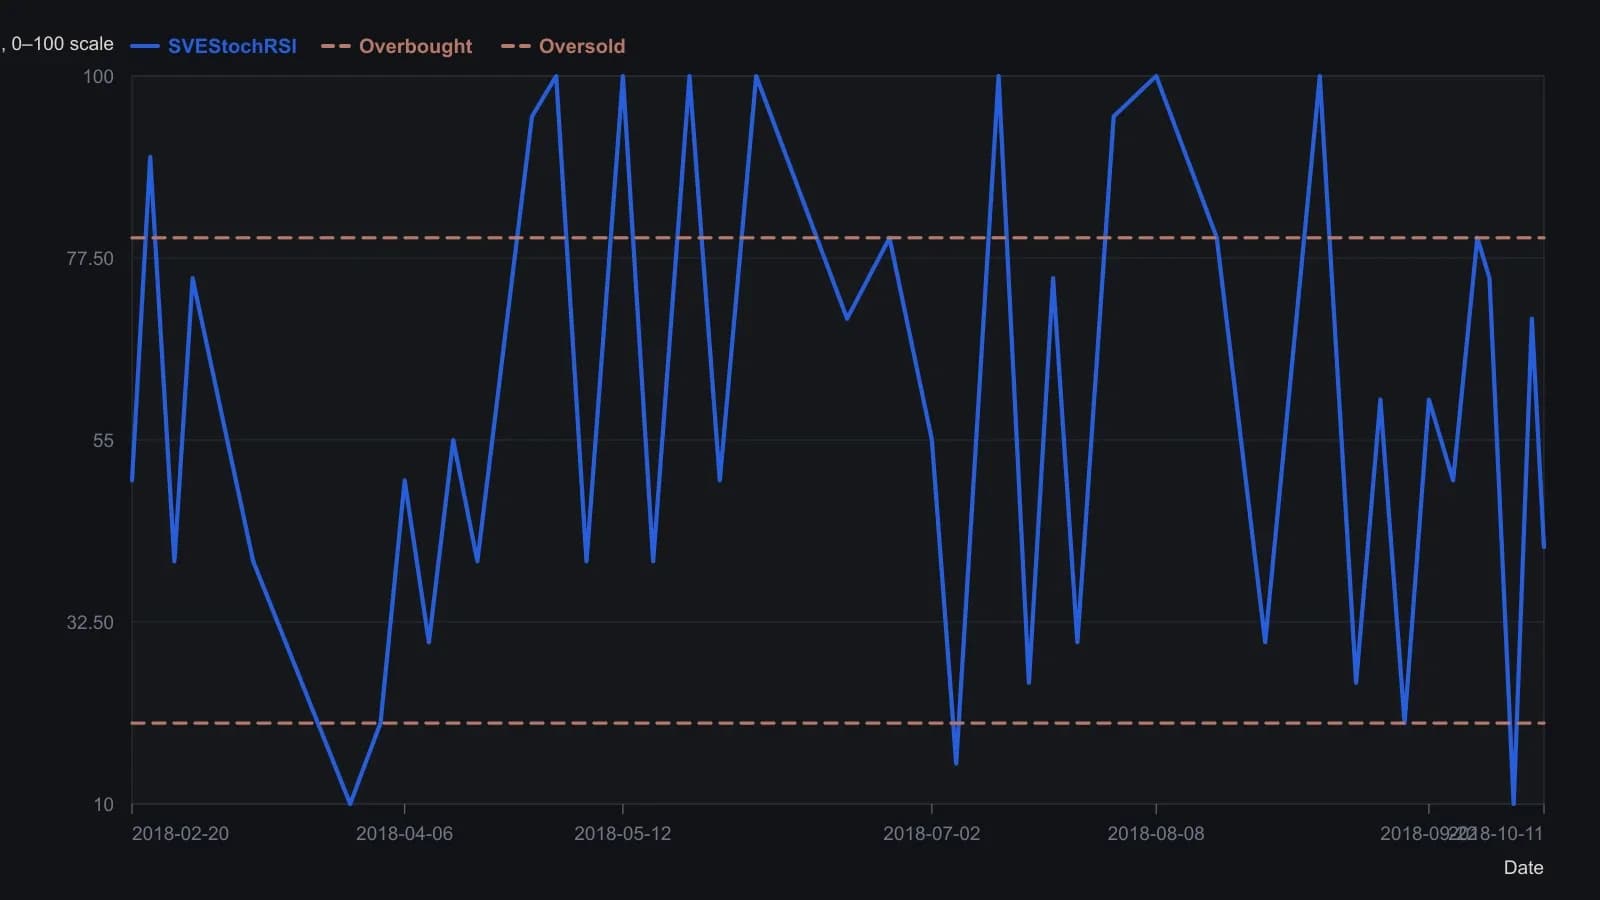
The pane is labelled SVEStochRSI(Close, 21, 8, 21). The sample short enters when the oscillator crosses under 70 after a negative divergence and exits on a six-bar timer. Peak and trough readings are approximate to the nearest five oscillator points.
All readings on this track · 32 readings
- 1989Volume confirmation windows and exponential average construction
- 1990Constructing stochastic %K and %D from range position
- 1990Build a weekly leading sector composite from scaled transports and financials
- 1990Constructing stochastic K and D lines and divergence cues
- 1993Relative strength index events depend on the chosen input combination
- 1995Constructing a dual-horizon force index
- 1996Building a range-normalized divergence index from relative strength index
- 1998Treat RSI as a testable filter rather than a trigger
- 1999Primary-cycle windows, then stochastic confirmation
- 1999Stochastic rules versus buy and hold
- 2001Constructing confirmation filters for RSI overbought and oversold extremes
- 2003Constructing divergence-equivalent relative strength index and stochastic oscillators
- 2003Reverse-engineered RSI as a next-close projection
- 2003Scoring open versus resolved relative strength divergences
- 2003Bull-and-bear-balance from OHLC bar patterns
- 2003Constructing bull and bear balance from session paths
- 2004Four-month rule: auto stocks as a market-regime warning
- 2004Constructing stochastic oscillator bands, crosses and divergence
- 2004Volume as an independent check on price oscillators
- 2004Simple dual confirmation for a short-horizon index-futures system
- 2005Confirm a stochastic divergence by reclaiming the first-swing bar
- 2005Weekly stochastic divergence and a long average on 2005 high-yield entrants
- 2005Predicted averages from related market baskets
- 2006Rank price-oscillator divergences, then filter by trend
- 2006Relative-spread-strength for cycle confirmation
- 2007Weekly breakout stretch and histogram divergence
- 2011A luxury-auction stock as a cross-market bubble warning
- 2014Running-percentile close divergences and trend filters
- 2015Rebuilding the relative strength index from close-to-average gaps
- 2016Constructing higher-high and lower-low stochastic pairs
- 2018Constructing composite relative-strength-index stochastics for reversal confirmation
- 2019Building a smoothed Stochastic oscillator of the Relative Strength Index for Price-indicator divergence checks