1999issue C091-7
Stochastic rules versus buy and hold
The stochastic oscillator locates the close inside a lookback range and can be read through %K versus %D, the 80 and 20 bands, or price-indicator divergence. A mechanical trading system comparison codes those readings as rule variants and scores them against buy and hold on the same window for each security.
- The stochastic oscillator places the close inside a chosen lookback range, so downtrends pin closes near the low and uptrends near the high until those positions reverse as a trend ends.
- Three readings are distinguished: %K versus %D, position versus the 80 and 20 bands, and price-indicator divergence. Only a divergence followed by a %K/%D cross was originally a complete signal.
- A mechanical trading system coded raw crosses, 80/20 filters, band exits, and joint-threshold crosses on daily bars and scored long and short trades in points against buy and hold.
- Buy and hold produced the largest net gain on the full 32-name panel, while a band-exit variant led on a six-name detailed subset and still required active management.
Where the close sits in the range
The stochastic oscillator locates the close inside a chosen lookback range. Downtrends tend to pin closes near the low of that range and uptrends near the high. Those positions reverse as a trend ends.
Three reading methods
Three reading methods are distinguished: %K versus %D, position versus the 80 and 20 bands, and price-indicator divergence versus price. The original presentation treated only a divergence followed by a %K/%D cross as a complete signal. The other two readings were confirmation or warning.
Even in that original divergence setup, %D had to sit beyond 80 or 20 for a bearish or bullish implication. Those same bands later became standalone overbought and oversold markers.
How %K and %D were paired
Fast %K uses a selected range period, commonly 5 or 10 bars, and may be averaged for slowing. %D is a slower average of %K. The illustrated default pairing is a five-bar range with no slowing and a three-bar simple average of %K.
Mechanical rules against buy and hold
A mechanical trading system coded several rule variants on daily bars: raw crosses, 80/20 filters, band exits, and joint-threshold crosses. Both long and short trades were taken at the next open after a signal. A fixed $5 commission was subtracted and no slippage was applied. Results were scored in points against buy and hold.
The same-period test window ran from 4 January 1993 to 2 July 1999 across 32 named equities. Later start dates were used only for Allstate, Gateway, and Safeskin. Every method used that security's identical window.
What the panel showed
Across the 32-stock panel, buy and hold produced the largest net gain. Thirty-one names were profitable under buy and hold, versus 24 under the best-performing coded system.
On the six names given detailed statistics, the band-exit variant (method 3) beat buy and hold on those stocks. It showed expectancy of 3.64, 0.019 net per bar versus 0.016 for buy and hold, 65% winning trades, and nearly half of winners on the short side. It still required active management and delivered less total net than buy and hold on the full 32-name set.
Thirty-two stocks: net-gain count by stochastic rule versus buy and hold
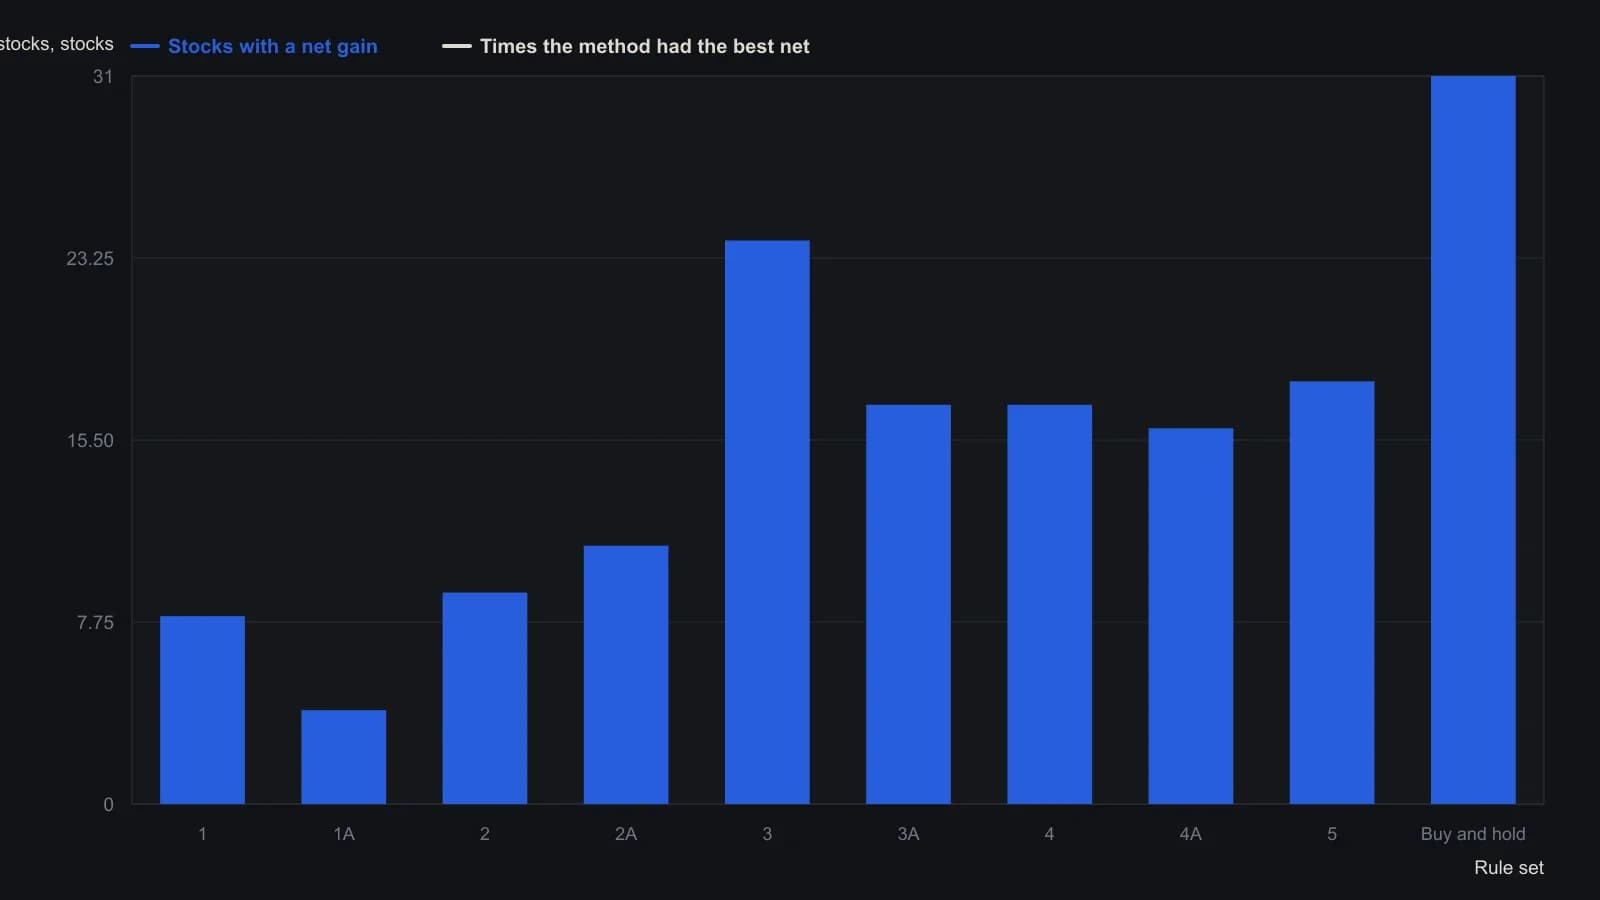
Daily bars, next-open fills, $5 commission and no slippage. Each method uses the same window on a given name. Methods 1–5 vary %K slowing and whether the 80 and 20 bands filter entries and exits. Test window is 4 January 1993 to 2 July 1999 except later starts for Allstate, Gateway and Safeskin.
Editorial note
This is an editorial reading, not an archive claim. The stochastic oscillator is better treated as a family of testable rule sets than as a single chart cue. Crossings, 80/20 bands, and price-indicator divergence should each be judged by whether a coded combination survives a documented out-of-sample comparison with an explicit baseline. The archive workflow compared coded variants with buy and hold on a shared same-period window for each security.
All readings on this track · 32 readings
- 1989Volume confirmation windows and exponential average construction
- 1990Constructing stochastic %K and %D from range position
- 1990Build a weekly leading sector composite from scaled transports and financials
- 1990Constructing stochastic K and D lines and divergence cues
- 1993Relative strength index events depend on the chosen input combination
- 1995Constructing a dual-horizon force index
- 1996Building a range-normalized divergence index from relative strength index
- 1998Treat RSI as a testable filter rather than a trigger
- 1999Primary-cycle windows, then stochastic confirmation
- 1999Stochastic rules versus buy and hold
- 2001Constructing confirmation filters for RSI overbought and oversold extremes
- 2003Constructing divergence-equivalent relative strength index and stochastic oscillators
- 2003Reverse-engineered RSI as a next-close projection
- 2003Scoring open versus resolved relative strength divergences
- 2003Bull-and-bear-balance from OHLC bar patterns
- 2003Constructing bull and bear balance from session paths
- 2004Four-month rule: auto stocks as a market-regime warning
- 2004Constructing stochastic oscillator bands, crosses and divergence
- 2004Volume as an independent check on price oscillators
- 2004Simple dual confirmation for a short-horizon index-futures system
- 2005Confirm a stochastic divergence by reclaiming the first-swing bar
- 2005Weekly stochastic divergence and a long average on 2005 high-yield entrants
- 2005Predicted averages from related market baskets
- 2006Rank price-oscillator divergences, then filter by trend
- 2006Relative-spread-strength for cycle confirmation
- 2007Weekly breakout stretch and histogram divergence
- 2011A luxury-auction stock as a cross-market bubble warning
- 2014Running-percentile close divergences and trend filters
- 2015Rebuilding the relative strength index from close-to-average gaps
- 2016Constructing higher-high and lower-low stochastic pairs
- 2018Constructing composite relative-strength-index stochastics for reversal confirmation
- 2019Building a smoothed Stochastic oscillator of the Relative Strength Index for Price-indicator divergence checks