2004issue C041-3
Volume as an independent check on price oscillators
A second series only critiques price if it can move independently. Stacked oscillators often restate the same price information, while volume is the participation series that can still disagree.
- Divergence is a directional mismatch: price moves one way without confirmation from another series under review.
- Stochastics, Williams %R, and RSI are grouped as near-substitutes that tend to restate the same kind of price information.
- Volume confirms a rise or a fall only when it expands with that move; contracting volume is counted as divergence in either direction.
- The proposed remedy for redundant price-indicator cues is to pair volume observations with price structure instead of stacking more price oscillators.
A second series has to be able to disagree
Divergence is treated as price moving one way without confirmation from another series under review. Confirmation means agreement between price direction and an independent series, not two restatements of the same price construct.
Editorial interpretation: a confirmation audit asks whether that second series can move independently of price. If it cannot, the extra line is not a critique of price. It is the same information drawn again.
Price oscillators that restate price
A five-minute Standard & Poor's 500 chart from April 10, 2003 is used to show three successive lower price lows against higher stochastic lows. The stochastic oscillator is a bounded oscillator of recent closes inside a high-low range, compared here with price swing highs and lows.
Stochastics, Williams %R, and RSI are grouped as near-substitutes that tend to restate the same kind of price information. Moving averages, MACD, DMI, ADX, stochastics, and %R are characterized as price-based constructs rather than independent participation measures.
Pair volume with price structure
The proposed remedy for redundant price-indicator cues is to pair volume observations with price structure instead of stacking more price oscillators. Volume-price analysis judges whether volume expands or contracts with a price move to see if that move is attracting participation.
On a five-minute June 2003 e-mini S&P chart from the same session, falling prices with declining volume are read as lower prices failing to attract new selling. Volume is treated as confirming a rise or a fall only when it expands with that move. Contracting volume is therefore counted as divergence in either direction.
A rapid volume surge with an accelerating price move is described as a possible exhaustion condition after many buyers and sellers have already been accommodated.
A gold high without matching volume
Gold futures are shown making a February 5, 2003 high of 388.90 on an unusually wide daily range without a matching volume expansion, then printing higher volume on February 6 as price turned lower.
The same gold episode is presented with a stochastic reading that also failed to confirm the price high.
Gold futures: February 2003 spike without confirming volume
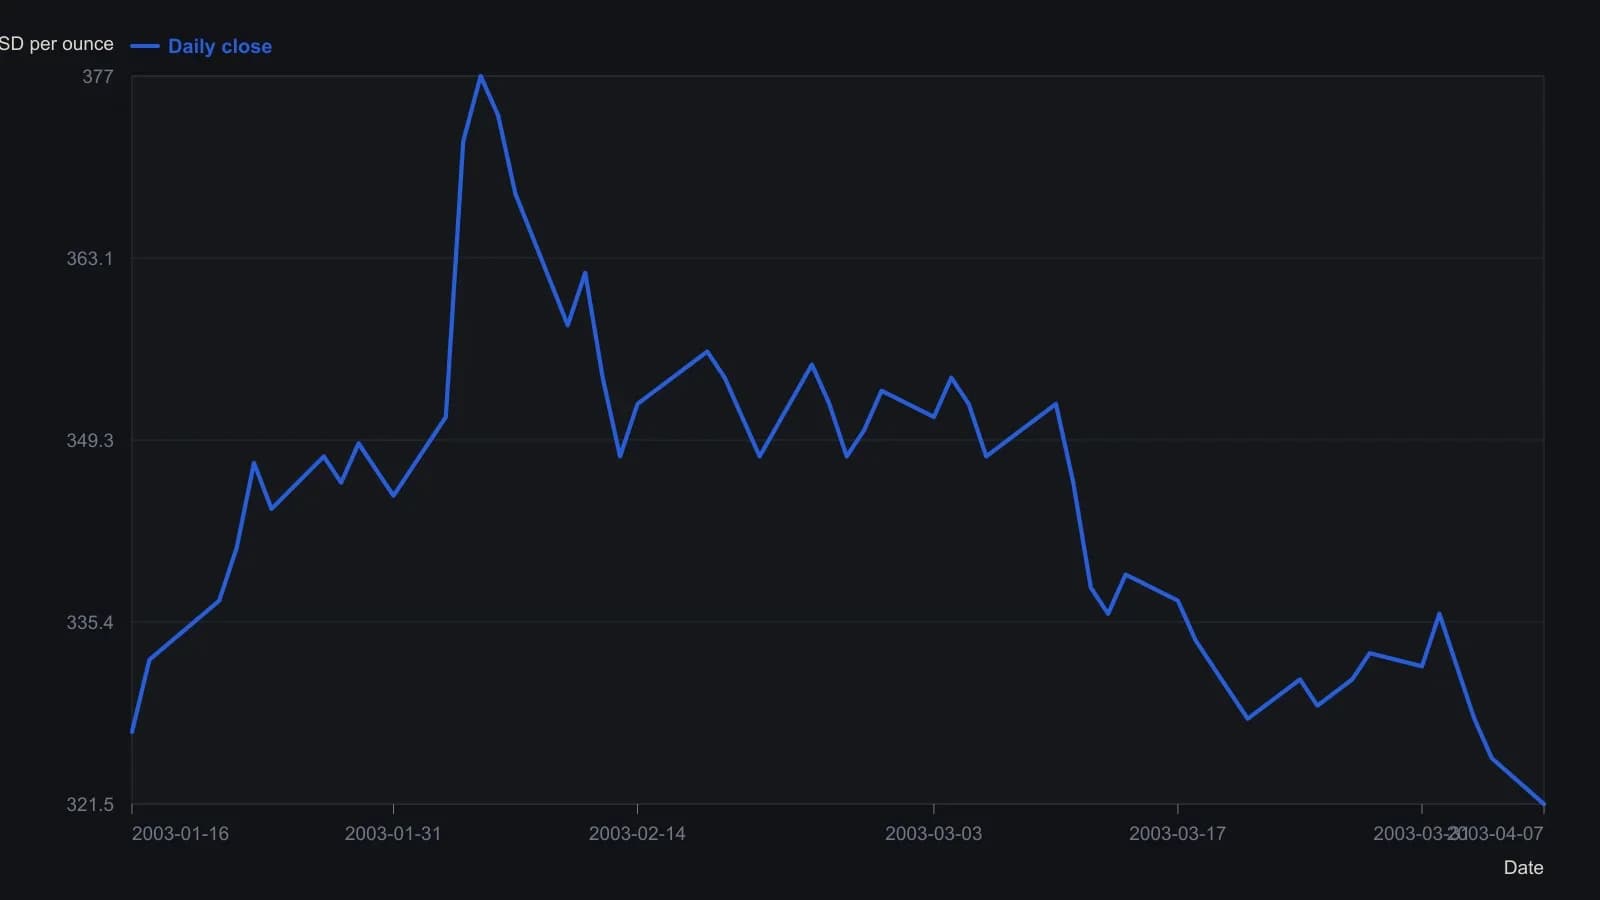
Price closes are approximate readings from the daily candlesticks (chart scale is 10× dollars). Volume is a same-session estimate in thousands of contracts. The 388.90 high on 5 February 2003 is taken from the article’s stated print, not from the raster.
All readings on this track · 32 readings
- 1989Volume confirmation windows and exponential average construction
- 1990Constructing stochastic %K and %D from range position
- 1990Build a weekly leading sector composite from scaled transports and financials
- 1990Constructing stochastic K and D lines and divergence cues
- 1993Relative strength index events depend on the chosen input combination
- 1995Constructing a dual-horizon force index
- 1996Building a range-normalized divergence index from relative strength index
- 1998Treat RSI as a testable filter rather than a trigger
- 1999Primary-cycle windows, then stochastic confirmation
- 1999Stochastic rules versus buy and hold
- 2001Constructing confirmation filters for RSI overbought and oversold extremes
- 2003Constructing divergence-equivalent relative strength index and stochastic oscillators
- 2003Reverse-engineered RSI as a next-close projection
- 2003Scoring open versus resolved relative strength divergences
- 2003Bull-and-bear-balance from OHLC bar patterns
- 2003Constructing bull and bear balance from session paths
- 2004Four-month rule: auto stocks as a market-regime warning
- 2004Constructing stochastic oscillator bands, crosses and divergence
- 2004Volume as an independent check on price oscillators
- 2004Simple dual confirmation for a short-horizon index-futures system
- 2005Confirm a stochastic divergence by reclaiming the first-swing bar
- 2005Weekly stochastic divergence and a long average on 2005 high-yield entrants
- 2005Predicted averages from related market baskets
- 2006Rank price-oscillator divergences, then filter by trend
- 2006Relative-spread-strength for cycle confirmation
- 2007Weekly breakout stretch and histogram divergence
- 2011A luxury-auction stock as a cross-market bubble warning
- 2014Running-percentile close divergences and trend filters
- 2015Rebuilding the relative strength index from close-to-average gaps
- 2016Constructing higher-high and lower-low stochastic pairs
- 2018Constructing composite relative-strength-index stochastics for reversal confirmation
- 2019Building a smoothed Stochastic oscillator of the Relative Strength Index for Price-indicator divergence checks