2006issue C061-5
Rank price-oscillator divergences, then filter by trend
Treat a price-versus-oscillator mismatch as a ranked reversal hypothesis, not a single chart event. Keep a stochastic oscillator as the comparison line on daily price structure, and let a trend-following filter decide whether any labeled split may become an entry, an exit, or a stay-out rule.
- Divergence is a split between two series that usually travel together, turned into a labeled reversal hypothesis rather than an automatic trade.
- A three-class ranking treats orthodox bearish divergence as the strongest bearish mismatch, a price double top divergence as a strong but lesser mismatch, and an indicator double top divergence as the weakest class, ignored unless another indicator confirms.
- Inverted divergence, a lower price high against a higher oscillator high, is read as bearish failed upside follow-through, while running divergence can abort the first mismatch.
- Trend following first names rising, falling, or sideways conditions, plus cycle stage and mood, and only then allows a top or bottom oscillator mismatch to become eligible for analysis.
A labeled split, not an automatic trade
Divergence is a split between two series that usually travel together, turned into a labeled reversal hypothesis rather than an automatic trade.
After an advance, a new price high paired with a lower high on a companion indicator is classified as a negative divergence. Some procedures treat that label as a reason to reduce, exit, or reverse a long stance before price itself breaks down.
A new price low paired with a higher low on the companion indicator is labeled a positive divergence. Mismatch can be read between price and an oscillator, between two price series, or between two oscillators. Confirmation is the opposite of divergence: those series continue to print fresh extremes together.
The illustrated comparison line is a stochastic oscillator specified as 7(4),10 on daily bars. That oscillator is a range-based reading of where the close sits inside a lookback window, drawn against daily price structure.
SOX daily close through an orthodox bullish split
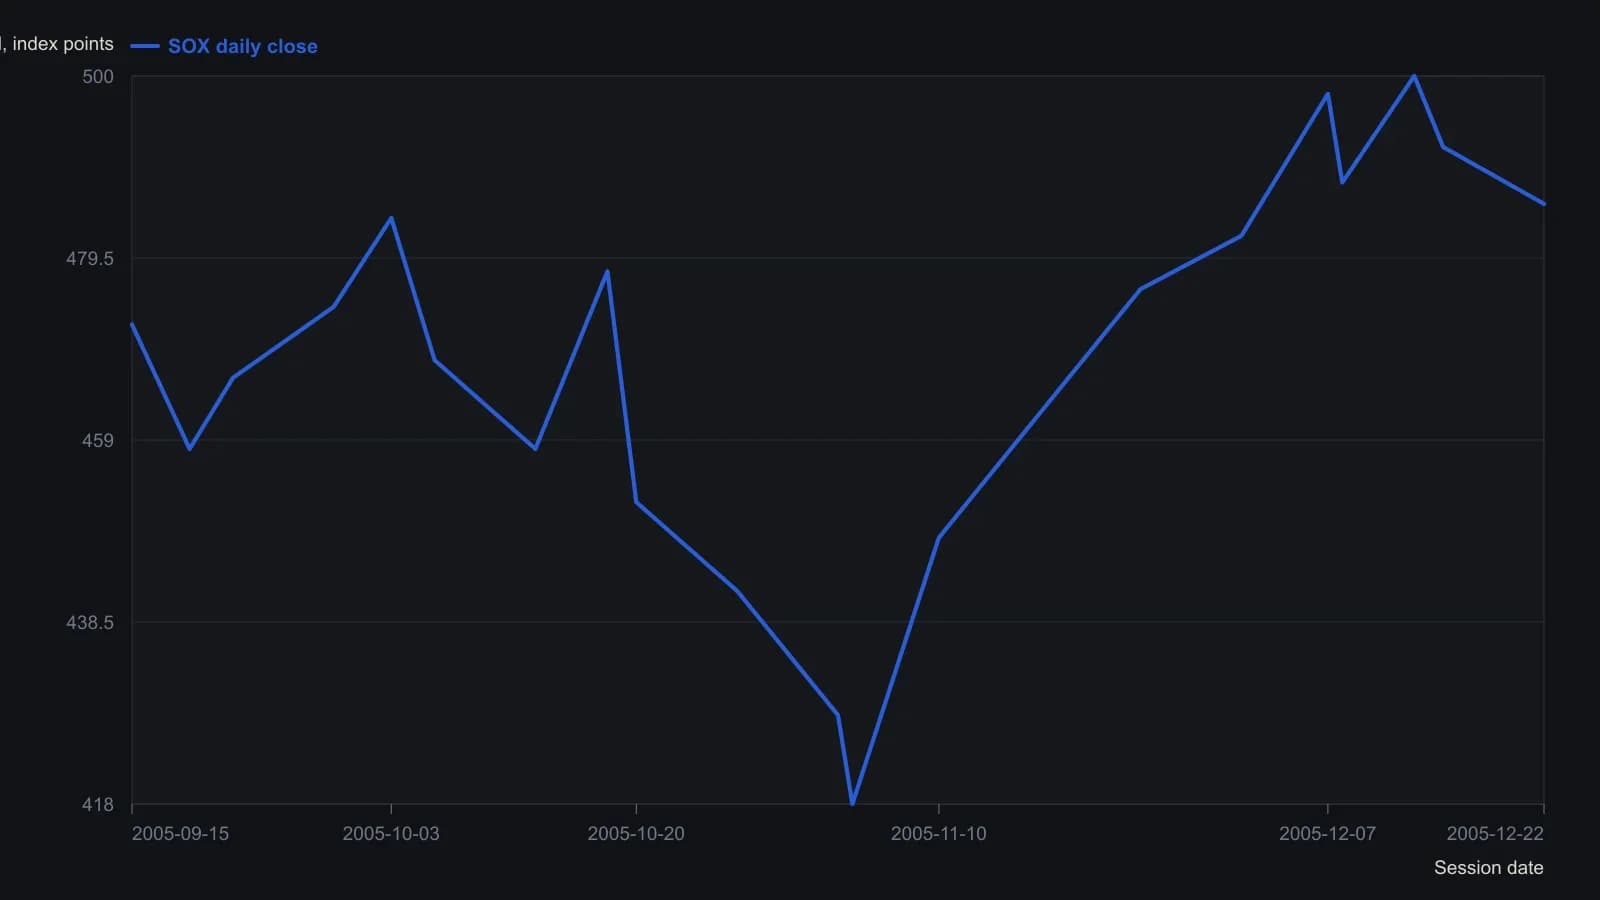
Source pane used Stochastic (7(4),10) as the comparison oscillator. Except for the labeled last close, prices are digitized from the raster and are only good to about two index points.
Three classes of bearish mismatch
A three-class ranking treats a higher price high versus a lower oscillator high as the strongest bearish mismatch. That structure is orthodox bearish divergence: successive higher highs in price against successive lower highs in the oscillator.
A price double top versus a lower oscillator high is a strong but lesser mismatch. That is a price double top divergence: equal price highs against a lower second high in the oscillator.
A higher price high versus equal oscillator highs is the weakest class. That is an indicator double top divergence, and the ranking says to ignore it unless another indicator confirms.
Inverted and running cases
A lower high in price against a higher high in the oscillator is inverted divergence. It is interpreted as bearish, on the reading that the market became more overbought while failing to make a new price high. The label is failed upside follow-through rather than a bullish all-clear.
A running sequence of new price highs against successively lower oscillator highs can abort the first mismatch. Running divergence is three or more successive price extremes that keep disagreeing with the oscillator. The procedure pairs that pattern with tight loss control and the option to re-enter after a small failed attempt.
Trend following as the governing filter
Trend following is treated as the governing filter. Rising, falling, or sideways conditions, plus cycle stage and mood, determine whether a top or bottom oscillator mismatch is even eligible for analysis. Only after those conditions are named does a divergence hypothesis fire.
A more conservative procedure withholds the sell or short until a trendline break or a close beneath a significant moving average. The same directional conclusion can therefore arrive later than a divergence-first rule.
All readings on this track · 32 readings
- 1989Volume confirmation windows and exponential average construction
- 1990Constructing stochastic %K and %D from range position
- 1990Build a weekly leading sector composite from scaled transports and financials
- 1990Constructing stochastic K and D lines and divergence cues
- 1993Relative strength index events depend on the chosen input combination
- 1995Constructing a dual-horizon force index
- 1996Building a range-normalized divergence index from relative strength index
- 1998Treat RSI as a testable filter rather than a trigger
- 1999Primary-cycle windows, then stochastic confirmation
- 1999Stochastic rules versus buy and hold
- 2001Constructing confirmation filters for RSI overbought and oversold extremes
- 2003Constructing divergence-equivalent relative strength index and stochastic oscillators
- 2003Reverse-engineered RSI as a next-close projection
- 2003Scoring open versus resolved relative strength divergences
- 2003Bull-and-bear-balance from OHLC bar patterns
- 2003Constructing bull and bear balance from session paths
- 2004Four-month rule: auto stocks as a market-regime warning
- 2004Constructing stochastic oscillator bands, crosses and divergence
- 2004Volume as an independent check on price oscillators
- 2004Simple dual confirmation for a short-horizon index-futures system
- 2005Confirm a stochastic divergence by reclaiming the first-swing bar
- 2005Weekly stochastic divergence and a long average on 2005 high-yield entrants
- 2005Predicted averages from related market baskets
- 2006Rank price-oscillator divergences, then filter by trend
- 2006Relative-spread-strength for cycle confirmation
- 2007Weekly breakout stretch and histogram divergence
- 2011A luxury-auction stock as a cross-market bubble warning
- 2014Running-percentile close divergences and trend filters
- 2015Rebuilding the relative strength index from close-to-average gaps
- 2016Constructing higher-high and lower-low stochastic pairs
- 2018Constructing composite relative-strength-index stochastics for reversal confirmation
- 2019Building a smoothed Stochastic oscillator of the Relative Strength Index for Price-indicator divergence checks