1993issue C071-8
Relative strength index events depend on the chosen input combination
A conventional relative strength index compares a market's own upward and downward closes over a stated lookback and is read between 0 and 100. Editorial reading: 30 and 70 events and price-indicator mismatches belong to a specific mix of lookback memory, moving-average smoother, input series, and sampling interval, so a chart reading is incomplete until that set is specified and a slower timeframe is used as a veto.
- A conventional relative strength index compares average upward closes with average downward closes over a stated lookback, commonly 14 periods, and stays bounded between 0 and 100.
- Carry-forward averages, recent-window recalculation, and the choice of a simple or exponentially smoothed moving average change how often the oscillator crosses 30 and 70.
- Volume, average-price substitutes, and a two-day price span change the shape of the line, and average-price inputs can still print false bullish divergences in a decline.
- Editorial reading: treat 30 and 70 crossings and price-indicator mismatches as properties of the full input set, then use a weekly direction filter before accepting a daily chart condition.
What a conventional relative strength index compares
A conventional relative strength index compares a market's own upward and downward closes over a defined lookback, most often 14 periods. It is read as a momentum oscillator bounded between 0 and 100.
How the lookback remembers price
After the first lookback window, the original averaging method carries the prior up-average and down-average forward, so both series keep a numeric value even on a session with no up close or no down close. Recalculating the oscillator from only the most recent 14 sessions, rather than from those carried-forward averages, is presented as a way to keep the reading on current data.
On a historical S&P 500 chart, the original 14-period oscillator produced fewer 30-up crossings and fewer 70-down crossings than a recent-window simple-average version of the same lookback. Replacing that simple recent-window average with an exponentially smoothed moving average also increased the number of 70 and 30 crossings relative to the original oscillator during a sideways range on the same series.
14-day RSI on December 1992 S&P 500: latest-window average versus Wilder
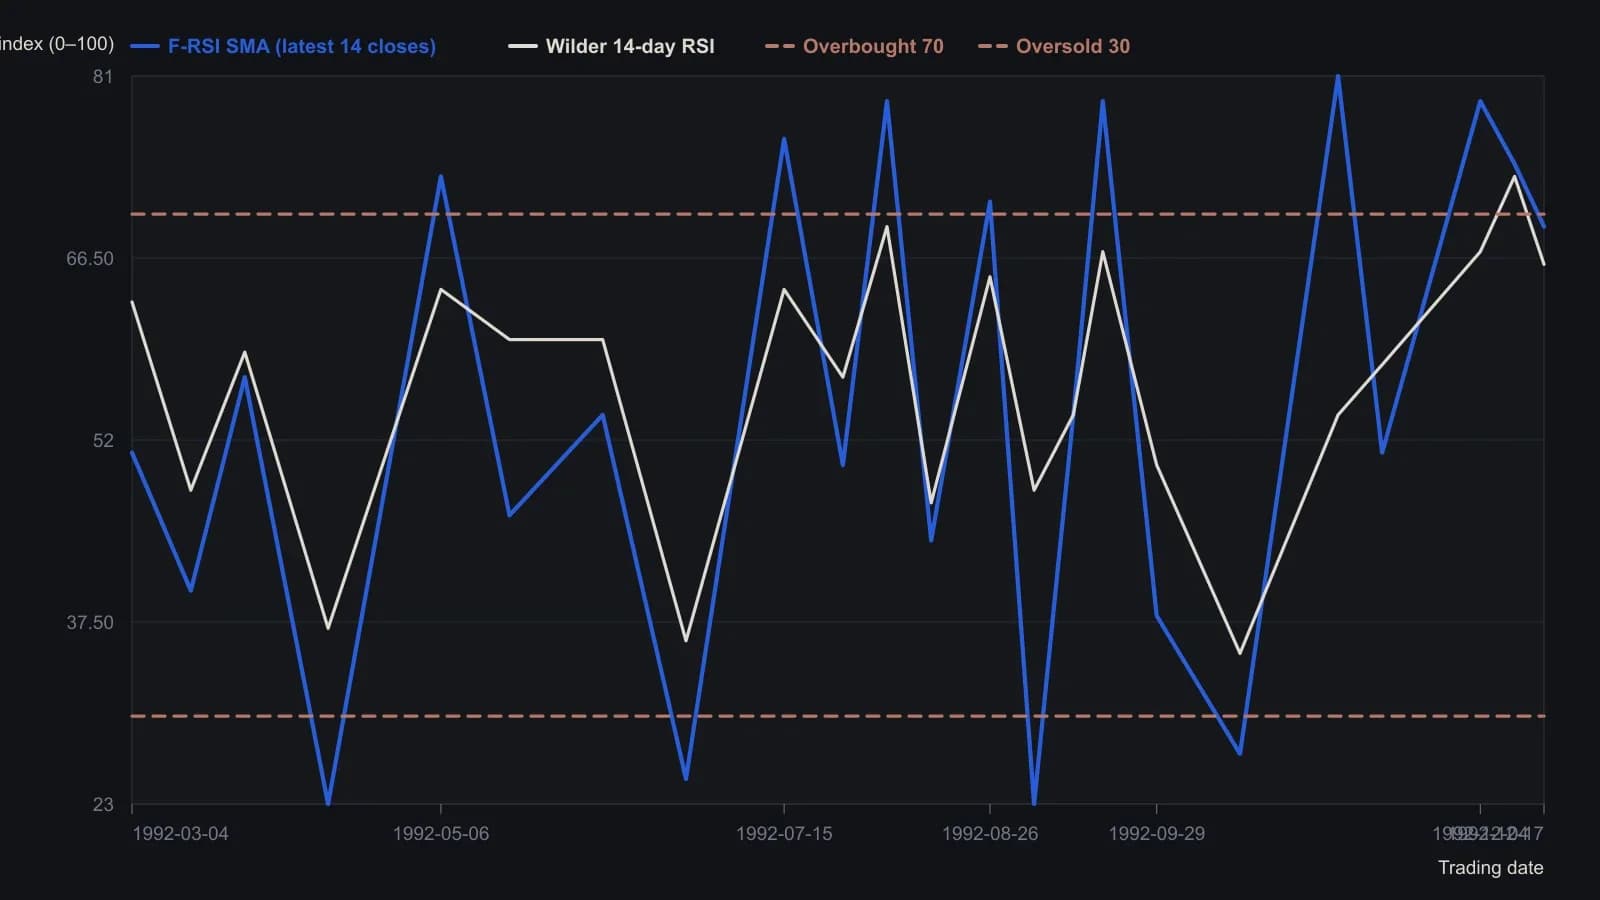
Wilder carries the prior up/down average forward; the F-RSI SMA recalculates a simple average on only the most recent 14 daily closes. Horizontal lines are the 70/30 bands used in the article. Raster resolution supports roughly a few RSI points, not tenths.
Volume, average price, and a two-day span
Adding volume to the modified oscillator is described as a way to reflect whether activity is entering or leaving a market. On a historical Treasury bond series, the volume-inclusive line marked bottoms more distinctly than the original oscillator.
Substituting an average price for the close, whether the high-low mean, the three-price mean, or the four-price mean, produced little difference among those averages. On General Motors, the high-low mean still produced false bullish divergences during a decline.
Pairing the current close with the prior session's open spans two days of price action. On historical Treasury bonds, that two-day price span produced a smoother oscillator line than the close-only original.
Overlay checks and a weekly direction filter
Overlaying the two-day variation on the original oscillator showed a recurring configuration in which the two-day line standing above the original line coincided with topping or downward-trend conditions. A later drop of the two-day line through 30 coincided with the end of a correction on the illustrated equity chart.
Because both the original oscillator and the variants are scaled from 0 to 100, they can print false divergences in trends. Applying the same 14-period exponentially smoothed variant on weekly bars as a direction filter reduced daily whipsaw and false divergences on the NYSE in a historical sample, including a stretch when daily readings crossed 70 while the weekly line stayed up.
Editorial reading: a daily 30 or 70 event, or a mismatch between a price extreme and an oscillator extreme, is a property of the chosen lookback memory, smoother, input series, and sampling interval. Specify that set before treating the chart condition as a complete reading, and use the weekly sampling of the same oscillator to accept or reject the daily case.
All readings on this track · 32 readings
- 1989Volume confirmation windows and exponential average construction
- 1990Constructing stochastic %K and %D from range position
- 1990Build a weekly leading sector composite from scaled transports and financials
- 1990Constructing stochastic K and D lines and divergence cues
- 1993Relative strength index events depend on the chosen input combination
- 1995Constructing a dual-horizon force index
- 1996Building a range-normalized divergence index from relative strength index
- 1998Treat RSI as a testable filter rather than a trigger
- 1999Primary-cycle windows, then stochastic confirmation
- 1999Stochastic rules versus buy and hold
- 2001Constructing confirmation filters for RSI overbought and oversold extremes
- 2003Constructing divergence-equivalent relative strength index and stochastic oscillators
- 2003Reverse-engineered RSI as a next-close projection
- 2003Scoring open versus resolved relative strength divergences
- 2003Bull-and-bear-balance from OHLC bar patterns
- 2003Constructing bull and bear balance from session paths
- 2004Four-month rule: auto stocks as a market-regime warning
- 2004Constructing stochastic oscillator bands, crosses and divergence
- 2004Volume as an independent check on price oscillators
- 2004Simple dual confirmation for a short-horizon index-futures system
- 2005Confirm a stochastic divergence by reclaiming the first-swing bar
- 2005Weekly stochastic divergence and a long average on 2005 high-yield entrants
- 2005Predicted averages from related market baskets
- 2006Rank price-oscillator divergences, then filter by trend
- 2006Relative-spread-strength for cycle confirmation
- 2007Weekly breakout stretch and histogram divergence
- 2011A luxury-auction stock as a cross-market bubble warning
- 2014Running-percentile close divergences and trend filters
- 2015Rebuilding the relative strength index from close-to-average gaps
- 2016Constructing higher-high and lower-low stochastic pairs
- 2018Constructing composite relative-strength-index stochastics for reversal confirmation
- 2019Building a smoothed Stochastic oscillator of the Relative Strength Index for Price-indicator divergence checks