2016issue C0250-56
Constructing higher-high and lower-low stochastic pairs
A higher-high stochastic and a lower-low stochastic can be assembled from gated range ratios and a shared lookback, then plotted as one paired study. The construction is a momentum overlay for testing trend-direction hypotheses, not a finished trading system.
- HHLLS plots two companion oscillators, HHS and LLS, as one paired study rather than a single stochastic line.
- Each gated range ratio is zero unless the latest high exceeds the prior high or the latest low falls below the prior low. When the gate is open, HHH and LLL locate that extreme inside the Length high or low range.
- Several implementations apply a 20-period XAverage to each gated ratio, scale the result by 100, and draw shared OverSold, Threshold, and OverBought guides at 10, 50, and 60.
- The pair is a momentum construction for judging trend direction. Suggested tests include level readings, oscillator crossovers, and price-versus-indicator divergence, and any Length change must update both the range windows and the smooth.
Two oscillators, one paired study
The construction produces two companion oscillators, a higher-high stochastic (HHS) and a lower-low stochastic (LLS). They are plotted together as one paired study (HHLLS) rather than a single line.
HHS is a smoothed oscillator of the current high versus the lookback high range, gated so the raw ratio is zero unless the latest high exceeds the prior high. LLS is a smoothed oscillator of the current low versus the lookback low range, gated so the raw ratio is zero unless the latest low is below the prior low. The pair is presented as a momentum construction for judging trend direction.
Gated range ratios
Each raw ratio is a gated range ratio: a stochastic-style position of the latest high or low inside its lookback envelope that is allowed to be nonzero only when that extreme makes a new higher high or lower low. The higher-high term is zero unless the current high exceeds the prior high. The lower-low term is zero unless the current low is below the prior low.
When the gate is open, the unsmoothed higher-high ratio (HHH) locates the current high between the lowest and highest highs over a 20-bar lookback. The unsmoothed lower-low ratio (LLL) locates the current low between the highest and lowest lows over the same lookback.
HHH is the current high minus the lowest high over Length, divided by the high-range width, or zero if the high did not rise versus the prior bar. LLL is the highest low over Length minus the current low, divided by the low-range width, or zero if the low did not fall versus the prior bar.
Smoothing, scaling, and Length
Several platform implementations then apply a 20-period exponential moving average (XAverage) to each gated ratio and scale the result by 100 before plotting. Length is the shared lookback used for the high or low range and, in several implementations, for the subsequent moving-average smooth.
Changing the lookback requires updating both the indicator period and the highest and lowest windows inside each formula so the range and the smooth stay aligned.
Shared reference levels
Shared horizontal references at 10, 50, and 60 are part of the published construction. They are used as OverSold, Threshold, and OverBought guides on the paired pane.
OverSold is the lower reference, commonly 10. Threshold is the mid-scale reference, commonly 50, used as a crossing level for alerts or trade-hypothesis tests. OverBought is the upper reference, commonly 60.
HHS and LLS on daily DJIA, August–December 2015
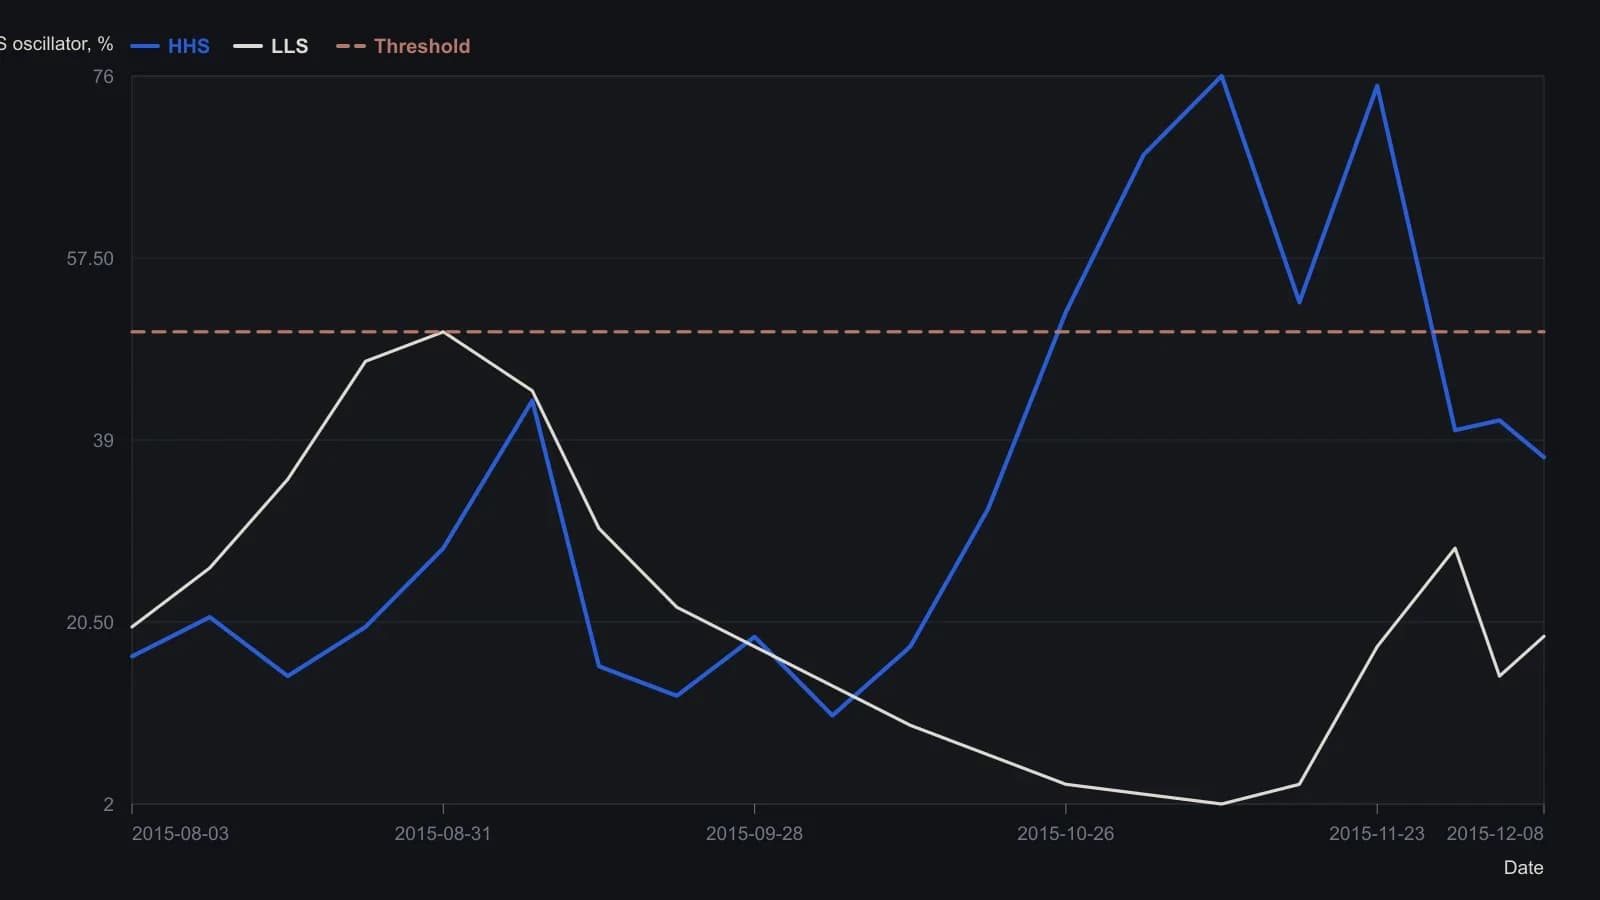
Length is the TradeStation default of 20. Interior points are approximate visual reads from the raster (± a few oscillator points); only the final prints come from the on-chart quote. The source pane also draws guides at 10 and 60, which are omitted here.
Follow-on tests, not a finished method
Suggested follow-on tests include overbought and oversold readings, oscillator crossovers, and indicator-versus-price divergences. Those checks belong to the construction as published next steps, not as a complete rule set.
In this usage, divergence is a price-versus-indicator disagreement proposed as a falsifiable turning-point hypothesis, not as a standalone confirmation.
All readings on this track · 32 readings
- 1989Volume confirmation windows and exponential average construction
- 1990Constructing stochastic %K and %D from range position
- 1990Build a weekly leading sector composite from scaled transports and financials
- 1990Constructing stochastic K and D lines and divergence cues
- 1993Relative strength index events depend on the chosen input combination
- 1995Constructing a dual-horizon force index
- 1996Building a range-normalized divergence index from relative strength index
- 1998Treat RSI as a testable filter rather than a trigger
- 1999Primary-cycle windows, then stochastic confirmation
- 1999Stochastic rules versus buy and hold
- 2001Constructing confirmation filters for RSI overbought and oversold extremes
- 2003Constructing divergence-equivalent relative strength index and stochastic oscillators
- 2003Reverse-engineered RSI as a next-close projection
- 2003Scoring open versus resolved relative strength divergences
- 2003Bull-and-bear-balance from OHLC bar patterns
- 2003Constructing bull and bear balance from session paths
- 2004Four-month rule: auto stocks as a market-regime warning
- 2004Constructing stochastic oscillator bands, crosses and divergence
- 2004Volume as an independent check on price oscillators
- 2004Simple dual confirmation for a short-horizon index-futures system
- 2005Confirm a stochastic divergence by reclaiming the first-swing bar
- 2005Weekly stochastic divergence and a long average on 2005 high-yield entrants
- 2005Predicted averages from related market baskets
- 2006Rank price-oscillator divergences, then filter by trend
- 2006Relative-spread-strength for cycle confirmation
- 2007Weekly breakout stretch and histogram divergence
- 2011A luxury-auction stock as a cross-market bubble warning
- 2014Running-percentile close divergences and trend filters
- 2015Rebuilding the relative strength index from close-to-average gaps
- 2016Constructing higher-high and lower-low stochastic pairs
- 2018Constructing composite relative-strength-index stochastics for reversal confirmation
- 2019Building a smoothed Stochastic oscillator of the Relative Strength Index for Price-indicator divergence checks