2004issue C041-2
Constructing stochastic oscillator bands, crosses and divergence
The stochastic oscillator is first a 0-100 close-location engine. After the lookback and the percent-K and percent-D pairing are fixed, the same reading can be taken as a band exit, a two-line cross, or a failure of the oscillator to confirm a new price extreme.
- The stochastic oscillator is a bounded 0-100 reading that locates the latest close inside a stated high-low lookback.
- Percent-K is the raw close-location line. Percent-D is a smoothed companion built either as a short summed-ratio or as a moving average of percent-K.
- The same engine can be read as a return through overbought-oversold bands, as a percent-K and percent-D line-crossover, or as price-indicator divergence.
- A positive divergence is a bullish non-confirmation in which price makes a lower low while the oscillator holds a comparable trough.
The close-location engine
The stochastic oscillator is a bounded 0-100 reading that locates the latest close inside a stated high-low lookback. A reading of 0 means the latest close equals the lowest price in the lookback. A reading of 100 means that close equals the highest price in the same window.
The model is justified by the observation that closes tend to cluster nearer the range low as prices fall and nearer the range high as prices rise.
Percent-K and percent-D
Percent-K is the raw close-location line, scaled from the latest close versus the lowest low and highest high of the lookback. One explicit percent-K construction scales the latest close minus the lowest low of the last five periods by that five-period high-low range, then multiplies the ratio by 100.
Percent-D is a smoothed companion to percent-K. One explicit percent-D construction scales a three-period sum of close-minus-lowest-low by a three-period sum of the matching high-low range, then multiplies that ratio by 100. A later two-line presentation treats percent-D as a moving average of percent-K rather than as a separately summed ratio.
Overbought and oversold band exits
One threshold construction treats a rise back through an oversold band, commonly 20 or 30, and a fall back through an overbought band, commonly 70 or 80, as the operative oscillator events. Those overbought-oversold bands are fixed upper and lower oscillator levels used to mark extreme close location inside the lookback.
December 2003 wheat, daily closes
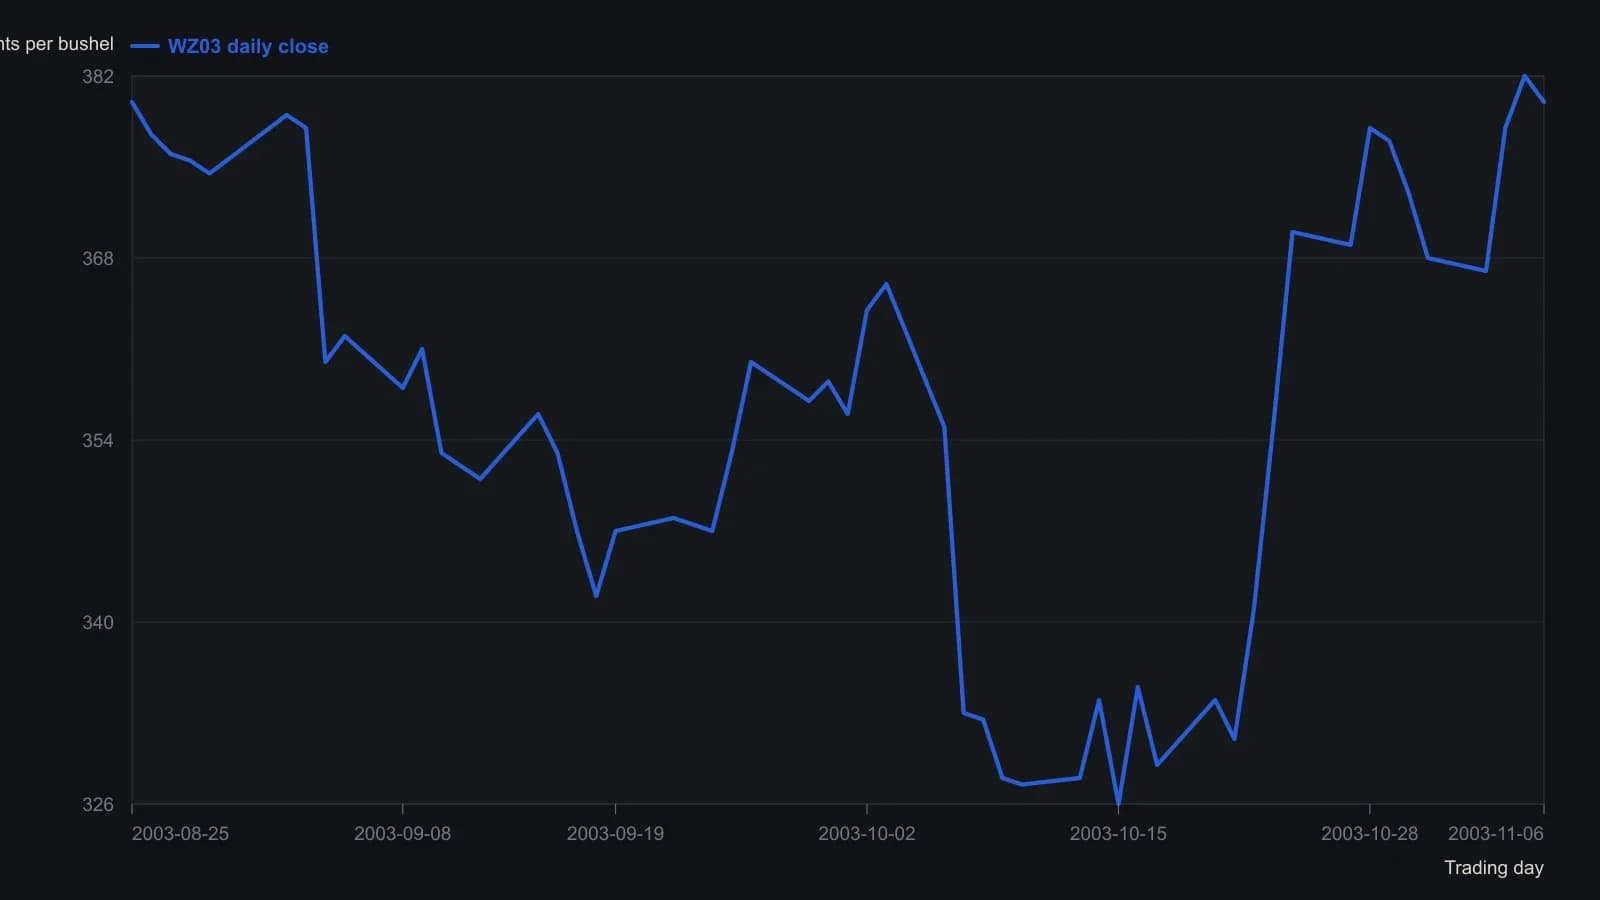
Closes were read from the OHLC bars on the published daily chart; eighths on the CBOT scale were rounded to the nearest half-cent. The %K/%D traces in the lower pane were too faint to digitize, so this series is price only.
Line-crossover of percent-K and percent-D
A second construction defines a change of state when percent-K crosses above percent-D or when percent-K crosses below percent-D. That line-crossover is a two-line construction in which the change of state is the cross itself.
Price-indicator divergence
A third construction treats a new price high or low that the oscillator does not match with a higher high or lower low as a divergence that may anticipate a reversal. Price-indicator divergence is a chart condition in which price prints a new high or low that the oscillator does not confirm with a matching extreme.
A December crude-oil futures example defines a positive divergence as price printing a lower low while the oscillator holds two troughs near the same level. Positive divergence is a bullish non-confirmation in which price makes a lower low while the oscillator holds a comparable trough.
All readings on this track · 32 readings
- 1989Volume confirmation windows and exponential average construction
- 1990Constructing stochastic %K and %D from range position
- 1990Build a weekly leading sector composite from scaled transports and financials
- 1990Constructing stochastic K and D lines and divergence cues
- 1993Relative strength index events depend on the chosen input combination
- 1995Constructing a dual-horizon force index
- 1996Building a range-normalized divergence index from relative strength index
- 1998Treat RSI as a testable filter rather than a trigger
- 1999Primary-cycle windows, then stochastic confirmation
- 1999Stochastic rules versus buy and hold
- 2001Constructing confirmation filters for RSI overbought and oversold extremes
- 2003Constructing divergence-equivalent relative strength index and stochastic oscillators
- 2003Reverse-engineered RSI as a next-close projection
- 2003Scoring open versus resolved relative strength divergences
- 2003Bull-and-bear-balance from OHLC bar patterns
- 2003Constructing bull and bear balance from session paths
- 2004Four-month rule: auto stocks as a market-regime warning
- 2004Constructing stochastic oscillator bands, crosses and divergence
- 2004Volume as an independent check on price oscillators
- 2004Simple dual confirmation for a short-horizon index-futures system
- 2005Confirm a stochastic divergence by reclaiming the first-swing bar
- 2005Weekly stochastic divergence and a long average on 2005 high-yield entrants
- 2005Predicted averages from related market baskets
- 2006Rank price-oscillator divergences, then filter by trend
- 2006Relative-spread-strength for cycle confirmation
- 2007Weekly breakout stretch and histogram divergence
- 2011A luxury-auction stock as a cross-market bubble warning
- 2014Running-percentile close divergences and trend filters
- 2015Rebuilding the relative strength index from close-to-average gaps
- 2016Constructing higher-high and lower-low stochastic pairs
- 2018Constructing composite relative-strength-index stochastics for reversal confirmation
- 2019Building a smoothed Stochastic oscillator of the Relative Strength Index for Price-indicator divergence checks