1996issue C011-6
Building a range-normalized divergence index from relative strength index
Lock which neighboring bars define a comparable high or low, place price and a relative strength index reading on the same range, then treat the signed remainder as a next-bar hypothesis instead of a freehand chart call.
- A candidate peak is accepted only after a chosen peak-strength count of lower highs appears on each side, so a small count compares nearby turns and a large count compares more substantial turns.
- Range-normalization divides each series change between two turns by that series own range over the same interval, mapping both terms onto a span from -1 to +1.
- The divergence index subtracts the indicator term from the price term at peaks, reverses the order at troughs, and reports a signed score bounded from +100 to -100.
- When the index is used as a timed condition, it is taken on the close of the confirmation bar, after a lower high confirms a peak or a higher low confirms a trough.
Start with the swing filter
Editorial framing: begin with the swing filter, not with the oscillator. The first lock is which neighboring bars define a comparable high or low.
A candidate peak is accepted only after a chosen count of lower highs appears on each side of it. A small peak-strength count compares nearby turns. A large peak-strength count compares more substantial turns.
Peak strength is that integer count of lower neighboring highs, or higher neighboring lows, required before a bar is accepted as a comparable turning point.
Place both series on the same range
To stop raw price units from dominating the score, each series change between two turns is divided by that series own range over the same interval. Range-normalization maps both terms onto a span from -1 to +1.
After that scaling, the construction subtracts the indicator term from the price term at peaks, reverses the order at troughs, and reports a signed divergence index bounded from +100 to -100.
Classic divergence is a joint case
Classic divergence is the joint case in which the current price extreme is beyond the prior price extreme while the indicator extreme is not.
Read the index on the confirmation bar
When the index is used as a timed condition, it is taken on the close of the following bar, after a lower high confirms a peak or a higher low confirms a trough. That following bar is the confirmation bar.
The construction treats a more positive reading as a reversal-leaning condition and a negative reading as a failed-extreme condition that then continues the prior move.
Two documented illustrations
A documented daily gold-futures case versus a 5-period relative strength index, with peak strength set to 1, computes a classic peak reading of 40 and a classic trough reading of 57.
A second documented case uses 15-minute equity-index futures versus a 10-period relative strength index with peak strength set to 5, requiring five lower highs on each side of an accepted peak.
Classic divergence index on December 1995 gold
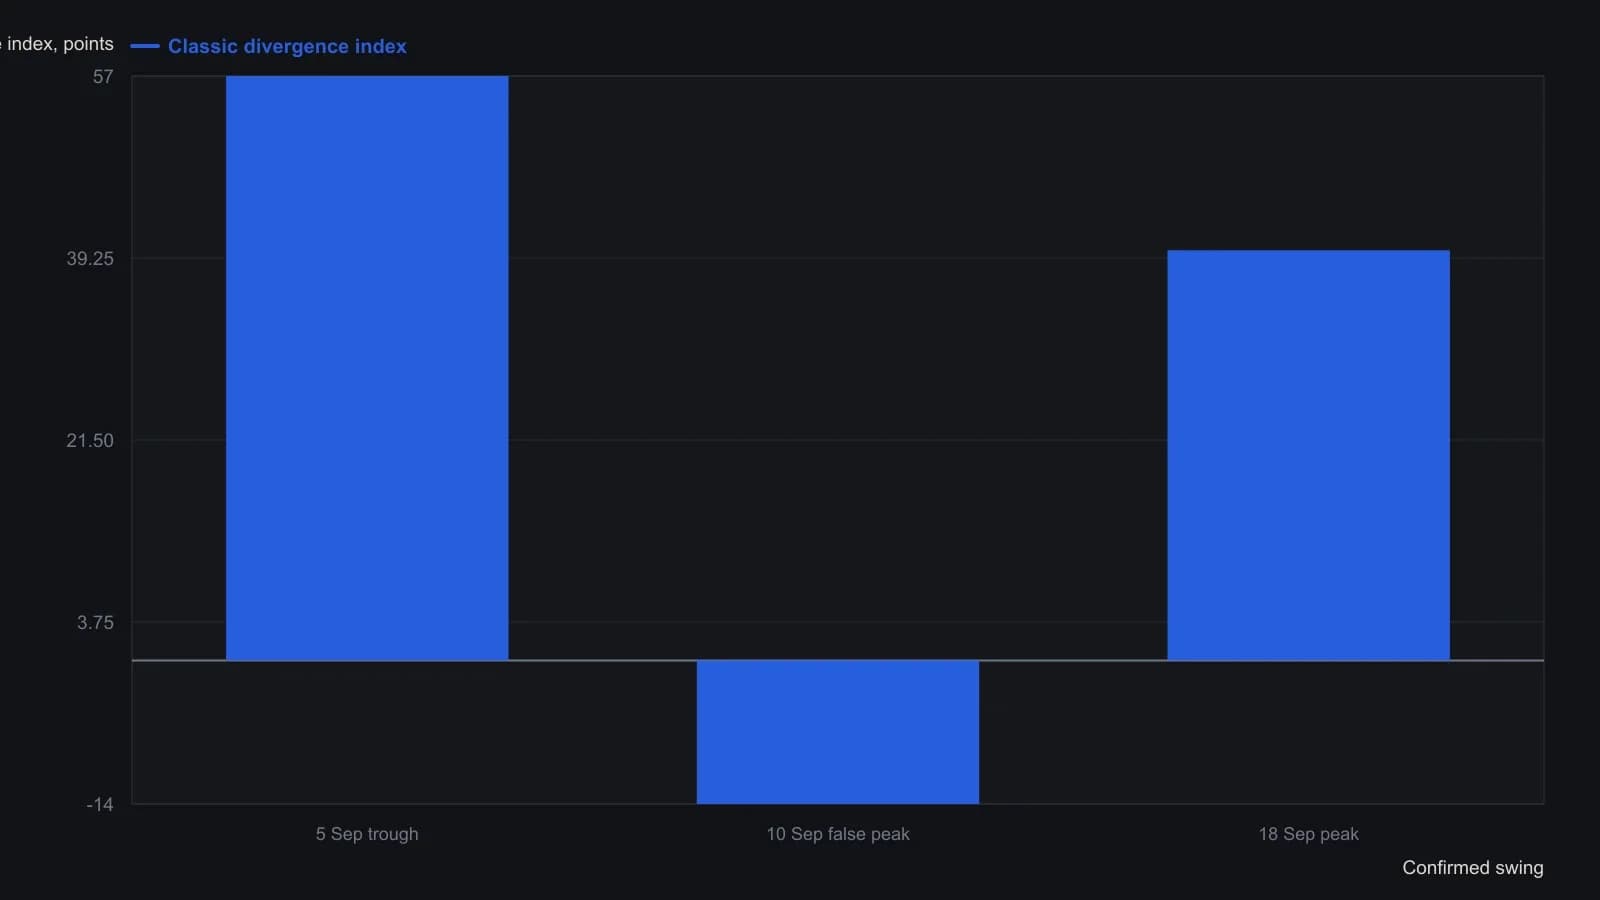
Peak-strength parameter is 1, so a peak is a high with a lower high on the neighboring bars. Only classic divergences are shown. The printed 40 and 57 are the formula results 39.64 and 56.63 rounded. The article’s figure note dates the +40 peak on September 16; the arithmetic in the body uses September 18. The trading signal is taken on the close of the confirmation bar after the swing.
The same comparison on any two series
The same range-normalized comparison can be applied to any two series, including two prices or two indicators, not only price versus one oscillator.
The construction is presented with two controls, peak strength and the chosen indicator expression, and is described as better applied when a market is not trending.
All readings on this track · 32 readings
- 1989Volume confirmation windows and exponential average construction
- 1990Constructing stochastic %K and %D from range position
- 1990Build a weekly leading sector composite from scaled transports and financials
- 1990Constructing stochastic K and D lines and divergence cues
- 1993Relative strength index events depend on the chosen input combination
- 1995Constructing a dual-horizon force index
- 1996Building a range-normalized divergence index from relative strength index
- 1998Treat RSI as a testable filter rather than a trigger
- 1999Primary-cycle windows, then stochastic confirmation
- 1999Stochastic rules versus buy and hold
- 2001Constructing confirmation filters for RSI overbought and oversold extremes
- 2003Constructing divergence-equivalent relative strength index and stochastic oscillators
- 2003Reverse-engineered RSI as a next-close projection
- 2003Scoring open versus resolved relative strength divergences
- 2003Bull-and-bear-balance from OHLC bar patterns
- 2003Constructing bull and bear balance from session paths
- 2004Four-month rule: auto stocks as a market-regime warning
- 2004Constructing stochastic oscillator bands, crosses and divergence
- 2004Volume as an independent check on price oscillators
- 2004Simple dual confirmation for a short-horizon index-futures system
- 2005Confirm a stochastic divergence by reclaiming the first-swing bar
- 2005Weekly stochastic divergence and a long average on 2005 high-yield entrants
- 2005Predicted averages from related market baskets
- 2006Rank price-oscillator divergences, then filter by trend
- 2006Relative-spread-strength for cycle confirmation
- 2007Weekly breakout stretch and histogram divergence
- 2011A luxury-auction stock as a cross-market bubble warning
- 2014Running-percentile close divergences and trend filters
- 2015Rebuilding the relative strength index from close-to-average gaps
- 2016Constructing higher-high and lower-low stochastic pairs
- 2018Constructing composite relative-strength-index stochastics for reversal confirmation
- 2019Building a smoothed Stochastic oscillator of the Relative Strength Index for Price-indicator divergence checks