2007issue C051-5
Weekly breakout stretch and histogram divergence
A weekly case study on Goldman Sachs and Altria Group treats a buy as live only after a later close clears the signal week's high, then uses moving-average extension to grade stretch and lets MACD histogram divergence become a sell only if named support fails.
- Breakout confirmation treats a weekly buy as live only after a later weekly close clears the high of the signal week.
- Moving-average extension measures the gap from the latest weekly close to a chosen exponential moving average and grades stretch rather than standing alone as an entry.
- MACD histogram divergence is a warning that becomes a sell only if a named breakdown level is breached.
- Consolidation support and trendline role reversal mark the bands that can invalidate a pending or confirmed breakout.
How the weekly sequence was applied
The archive workflow on these weekly charts separated a printed buy from a live one. Breakout confirmation treated a weekly buy as live only after a later weekly close cleared the high of the signal week.
Once that close was in view, the gap between the latest weekly close and a chosen exponential moving average was used as moving-average extension, a stretch gauge rather than a standalone entry.
MACD histogram divergence, with price making a higher high while the MACD histogram made a lower high, was treated as a warning that became a sell only if a named breakdown level was breached.
Goldman Sachs: confirmation, stretch, and a named sell
On the weekly Goldman Sachs chart, a MACD-histogram buy for the week ended 12 January was treated as unconfirmed until a later weekly close cleared that week's high of 214.22.
Goldman Sachs had just left a mid-to-late November 2006 consolidation. That band was defined as major support, the consolidation support that launched the breakout and later serves as the invalidation band if price falls back into or through it. A move back into or beneath that band was listed as a reason for concern or an exit.
With a latest weekly close near 210, Goldman Sachs stood about 20 points above its 20-week exponential moving average and about 40 points above its 50-week exponential moving average. That gap was read as increasingly extended.
A developing negative divergence on the weekly MACD histogram was described as becoming a sell on any daily print below 200, the low of the late-November to December consolidation. If Goldman Sachs pulled back, the named supports were the 20-week exponential moving average near 195 and the 170 area that lined up with the 50-week average, the early-October breakout, and about a 61.8 percent Fibonacci retracement from the prevailing highs.
Goldman Sachs weekly close versus 20- and 50-week EMAs
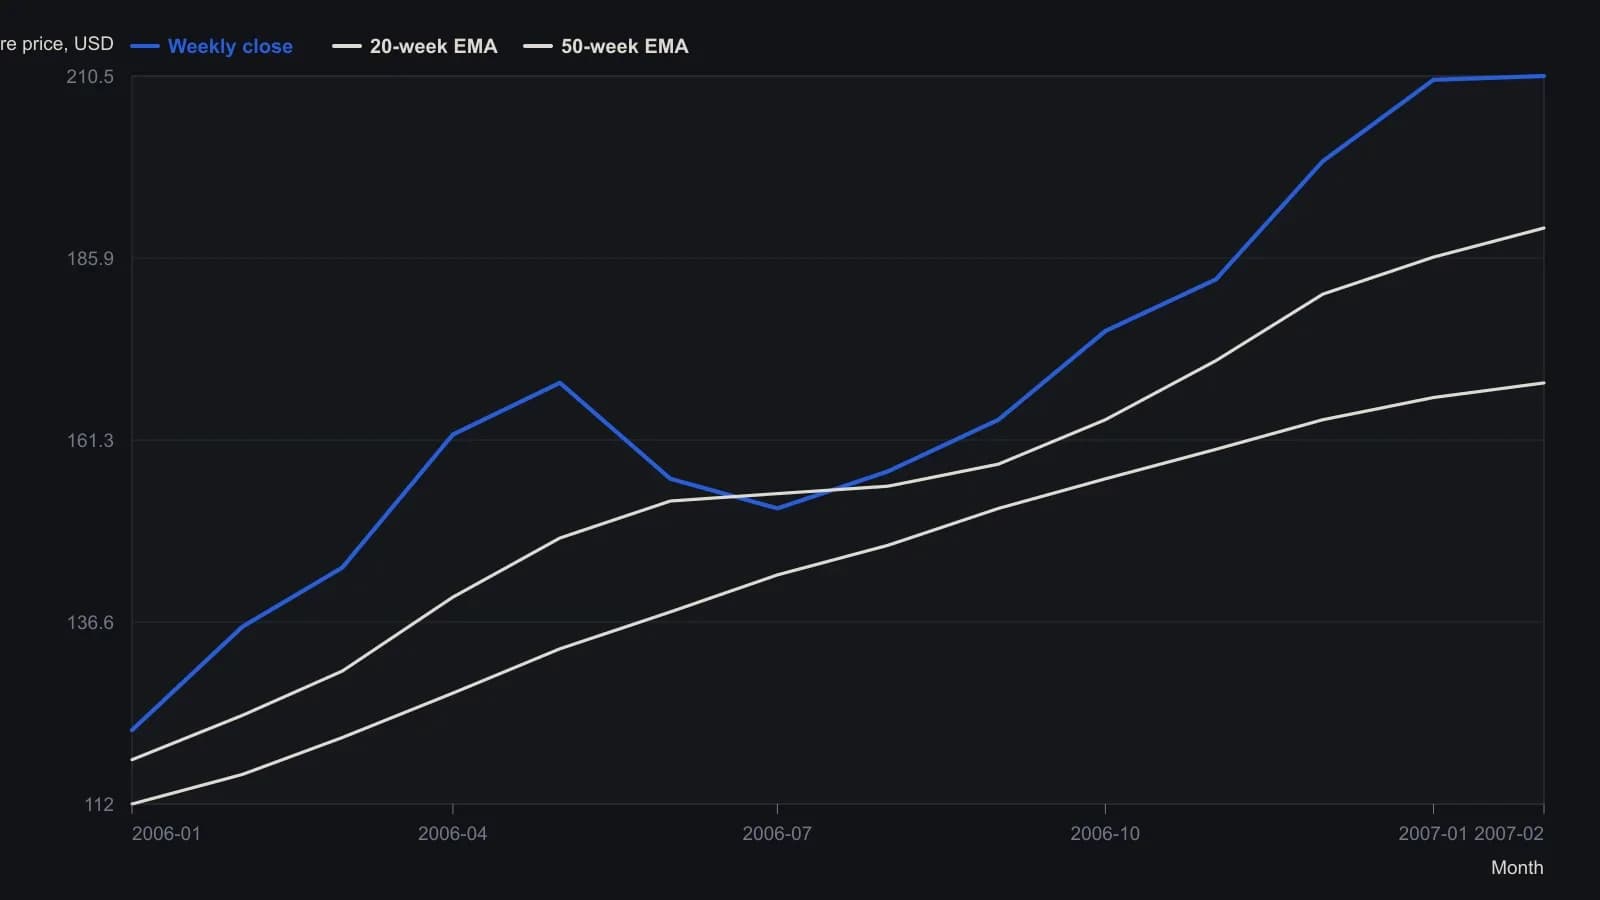
Weekly candles digitized at monthly resolution, so path points are approximate except the final 210.51 / 189.94 / 168.98 quote-box prints. The later prose supports at 195 and 170 are rounded figures from a slightly later reading than that box.
Altria Group: confirmed buys and trendline role reversal
Altria Group's last weekly buy printed for the week ended 29 December and was confirmed by a higher weekly close of 87.15 in the week ended 5 January. An earlier weekly buy from the week ended 27 October was confirmed at 85 in the week ended 17 November.
After Altria Group lost a long-term trendline that had supported it at the end of the 2004 decline, that same line was read as overhead resistance. That reading is trendline role reversal. The broader weekly trend remained up, and the last close near 87 sat above a 20-week exponential moving average above 83.
The Altria Group advance was noted as occurring on less than robust volume. A possible negative divergence, with higher August-to-January price highs against lower MACD-histogram highs, was flagged but given limited weight because the January high was not treated as a reliable peak.
Halliburton: unfinished histogram repair
On the weekly Halliburton chart, downside tails suggested fading selling pressure while the MACD histogram kept posting lower readings. The name was treated as still vulnerable until that histogram made higher lows while oversold or began making higher highs.
Editorial reading of the three-layer checklist
Editorial reading: TradersWeek frames these archive notes as a three-layer checklist. The first layer is breakout confirmation. The second is moving-average extension as a stretch grade after that close. The third is MACD histogram divergence as an independent condition that can overturn the setup if a stated support band fails.
Editorial note: a latest Goldman Sachs weekly close near 210 sits below the 214.22 signal-week high, so the stated confirmation close had not yet occurred. Altria Group is the contrasting case in which later weekly closes did confirm. Halliburton shows histogram damage without a completed repair, even as downside tails hinted at fading selling pressure.
All readings on this track · 32 readings
- 1989Volume confirmation windows and exponential average construction
- 1990Constructing stochastic %K and %D from range position
- 1990Build a weekly leading sector composite from scaled transports and financials
- 1990Constructing stochastic K and D lines and divergence cues
- 1993Relative strength index events depend on the chosen input combination
- 1995Constructing a dual-horizon force index
- 1996Building a range-normalized divergence index from relative strength index
- 1998Treat RSI as a testable filter rather than a trigger
- 1999Primary-cycle windows, then stochastic confirmation
- 1999Stochastic rules versus buy and hold
- 2001Constructing confirmation filters for RSI overbought and oversold extremes
- 2003Constructing divergence-equivalent relative strength index and stochastic oscillators
- 2003Reverse-engineered RSI as a next-close projection
- 2003Scoring open versus resolved relative strength divergences
- 2003Bull-and-bear-balance from OHLC bar patterns
- 2003Constructing bull and bear balance from session paths
- 2004Four-month rule: auto stocks as a market-regime warning
- 2004Constructing stochastic oscillator bands, crosses and divergence
- 2004Volume as an independent check on price oscillators
- 2004Simple dual confirmation for a short-horizon index-futures system
- 2005Confirm a stochastic divergence by reclaiming the first-swing bar
- 2005Weekly stochastic divergence and a long average on 2005 high-yield entrants
- 2005Predicted averages from related market baskets
- 2006Rank price-oscillator divergences, then filter by trend
- 2006Relative-spread-strength for cycle confirmation
- 2007Weekly breakout stretch and histogram divergence
- 2011A luxury-auction stock as a cross-market bubble warning
- 2014Running-percentile close divergences and trend filters
- 2015Rebuilding the relative strength index from close-to-average gaps
- 2016Constructing higher-high and lower-low stochastic pairs
- 2018Constructing composite relative-strength-index stochastics for reversal confirmation
- 2019Building a smoothed Stochastic oscillator of the Relative Strength Index for Price-indicator divergence checks